Egyptian vs Jamaican 1 or more Vehicles in Household
COMPARE
Egyptian
Jamaican
1 or more Vehicles in Household
1 or more Vehicles in Household Comparison
Egyptians
Jamaicans
88.2%
1 OR MORE VEHICLES IN HOUSEHOLD
1.2/ 100
METRIC RATING
250th/ 347
METRIC RANK
82.1%
1 OR MORE VEHICLES IN HOUSEHOLD
0.0/ 100
METRIC RATING
321st/ 347
METRIC RANK
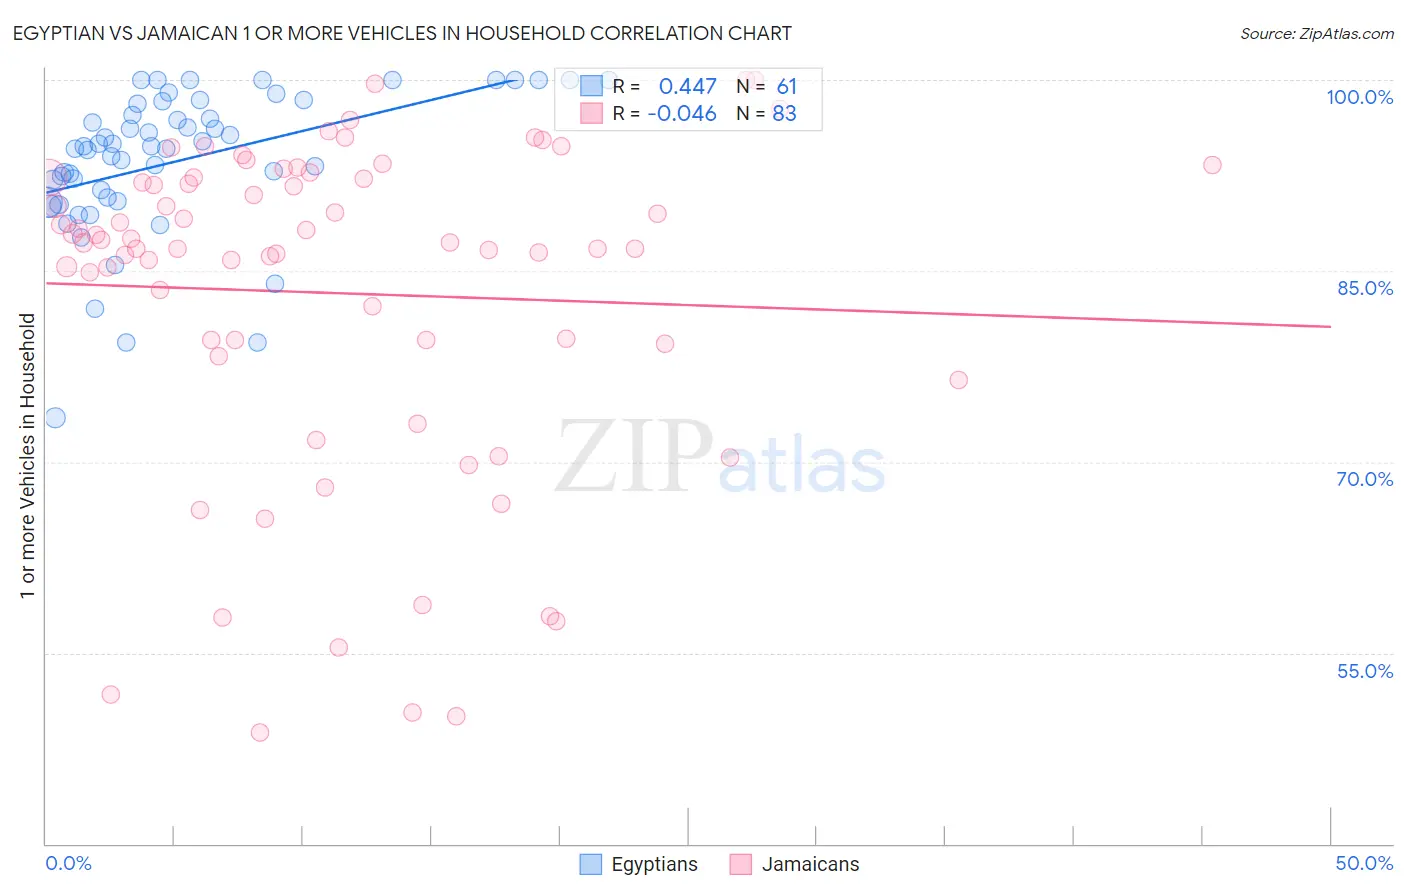
Egyptian vs Jamaican 1 or more Vehicles in Household Correlation Chart
The statistical analysis conducted on geographies consisting of 276,665,499 people shows a moderate positive correlation between the proportion of Egyptians and percentage of households with 1 or more vehicles available in the United States with a correlation coefficient (R) of 0.447 and weighted average of 88.2%. Similarly, the statistical analysis conducted on geographies consisting of 367,719,271 people shows no correlation between the proportion of Jamaicans and percentage of households with 1 or more vehicles available in the United States with a correlation coefficient (R) of -0.046 and weighted average of 82.1%, a difference of 7.3%.
1 or more Vehicles in Household Correlation Summary
| Measurement | Egyptian | Jamaican |
| Minimum | 73.5% | 48.7% |
| Maximum | 100.0% | 100.0% |
| Range | 26.5% | 51.3% |
| Mean | 93.7% | 83.3% |
| Median | 94.7% | 87.2% |
| Interquartile 25% (IQ1) | 90.6% | 79.3% |
| Interquartile 75% (IQ3) | 98.2% | 92.3% |
| Interquartile Range (IQR) | 7.6% | 13.0% |
| Standard Deviation (Sample) | 5.7% | 13.0% |
| Standard Deviation (Population) | 5.6% | 12.9% |
Similar Demographics by 1 or more Vehicles in Household
Demographics Similar to Egyptians by 1 or more Vehicles in Household
In terms of 1 or more vehicles in household, the demographic groups most similar to Egyptians are Immigrants from Serbia (88.2%, a difference of 0.010%), Black/African American (88.2%, a difference of 0.040%), Immigrants from Uruguay (88.1%, a difference of 0.060%), Immigrants from Nigeria (88.2%, a difference of 0.090%), and Honduran (88.1%, a difference of 0.10%).
| Demographics | Rating | Rank | 1 or more Vehicles in Household |
| Immigrants | Belgium | 2.1 /100 | #243 | Tragic 88.4% |
| Immigrants | Portugal | 2.0 /100 | #244 | Tragic 88.3% |
| Immigrants | Czechoslovakia | 1.9 /100 | #245 | Tragic 88.3% |
| Menominee | 1.9 /100 | #246 | Tragic 88.3% |
| Immigrants | Honduras | 1.7 /100 | #247 | Tragic 88.3% |
| Immigrants | Nigeria | 1.5 /100 | #248 | Tragic 88.2% |
| Blacks/African Americans | 1.4 /100 | #249 | Tragic 88.2% |
| Egyptians | 1.2 /100 | #250 | Tragic 88.2% |
| Immigrants | Serbia | 1.2 /100 | #251 | Tragic 88.2% |
| Immigrants | Uruguay | 1.1 /100 | #252 | Tragic 88.1% |
| Hondurans | 1.0 /100 | #253 | Tragic 88.1% |
| Haitians | 0.9 /100 | #254 | Tragic 88.1% |
| Immigrants | Latvia | 0.9 /100 | #255 | Tragic 88.1% |
| Colombians | 0.9 /100 | #256 | Tragic 88.0% |
| Liberians | 0.9 /100 | #257 | Tragic 88.0% |
Demographics Similar to Jamaicans by 1 or more Vehicles in Household
In terms of 1 or more vehicles in household, the demographic groups most similar to Jamaicans are Soviet Union (82.7%, a difference of 0.64%), Immigrants from Cabo Verde (81.6%, a difference of 0.67%), Immigrants from Belarus (83.3%, a difference of 1.5%), Immigrants from Ghana (83.4%, a difference of 1.6%), and Ghanaian (83.6%, a difference of 1.8%).
| Demographics | Rating | Rank | 1 or more Vehicles in Household |
| Albanians | 0.0 /100 | #314 | Tragic 84.4% |
| Cypriots | 0.0 /100 | #315 | Tragic 84.4% |
| Alaska Natives | 0.0 /100 | #316 | Tragic 83.8% |
| Ghanaians | 0.0 /100 | #317 | Tragic 83.6% |
| Immigrants | Ghana | 0.0 /100 | #318 | Tragic 83.4% |
| Immigrants | Belarus | 0.0 /100 | #319 | Tragic 83.3% |
| Soviet Union | 0.0 /100 | #320 | Tragic 82.7% |
| Jamaicans | 0.0 /100 | #321 | Tragic 82.1% |
| Immigrants | Cabo Verde | 0.0 /100 | #322 | Tragic 81.6% |
| Immigrants | Yemen | 0.0 /100 | #323 | Tragic 80.5% |
| Immigrants | Caribbean | 0.0 /100 | #324 | Tragic 80.4% |
| Senegalese | 0.0 /100 | #325 | Tragic 80.4% |
| Immigrants | West Indies | 0.0 /100 | #326 | Tragic 79.5% |
| Immigrants | Senegal | 0.0 /100 | #327 | Tragic 79.0% |
| Ecuadorians | 0.0 /100 | #328 | Tragic 77.9% |