Immigrants from Bahamas vs French 4 or more Vehicles in Household
COMPARE
Immigrants from Bahamas
French
4 or more Vehicles in Household
4 or more Vehicles in Household Comparison
Immigrants from Bahamas
French
5.3%
4 OR MORE VEHICLES IN HOUSEHOLD
0.1/ 100
METRIC RATING
291st/ 347
METRIC RANK
6.9%
4 OR MORE VEHICLES IN HOUSEHOLD
97.7/ 100
METRIC RATING
108th/ 347
METRIC RANK
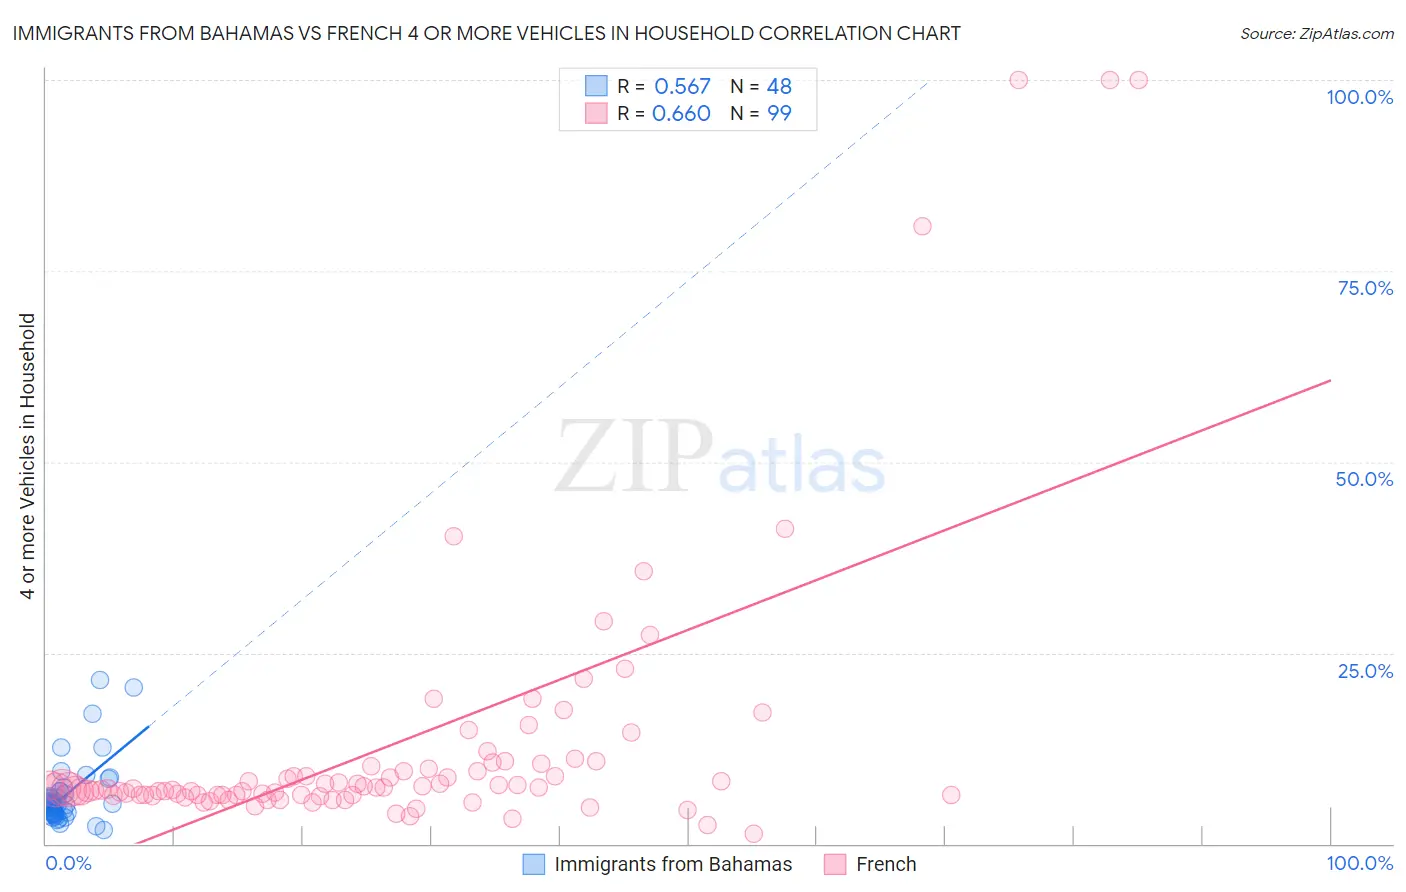
Immigrants from Bahamas vs French 4 or more Vehicles in Household Correlation Chart
The statistical analysis conducted on geographies consisting of 104,355,564 people shows a substantial positive correlation between the proportion of Immigrants from Bahamas and percentage of households with 4 or more vehicles available in the United States with a correlation coefficient (R) of 0.567 and weighted average of 5.3%. Similarly, the statistical analysis conducted on geographies consisting of 568,874,397 people shows a significant positive correlation between the proportion of French and percentage of households with 4 or more vehicles available in the United States with a correlation coefficient (R) of 0.660 and weighted average of 6.9%, a difference of 31.8%.
4 or more Vehicles in Household Correlation Summary
| Measurement | Immigrants from Bahamas | French |
| Minimum | 1.9% | 1.3% |
| Maximum | 21.5% | 100.0% |
| Range | 19.6% | 98.7% |
| Mean | 6.4% | 13.0% |
| Median | 5.3% | 7.2% |
| Interquartile 25% (IQ1) | 4.1% | 6.4% |
| Interquartile 75% (IQ3) | 6.8% | 10.2% |
| Interquartile Range (IQR) | 2.7% | 3.8% |
| Standard Deviation (Sample) | 4.1% | 18.4% |
| Standard Deviation (Population) | 4.1% | 18.3% |
Similar Demographics by 4 or more Vehicles in Household
Demographics Similar to Immigrants from Bahamas by 4 or more Vehicles in Household
In terms of 4 or more vehicles in household, the demographic groups most similar to Immigrants from Bahamas are Liberian (5.3%, a difference of 0.10%), Immigrants from Congo (5.2%, a difference of 0.13%), Ghanaian (5.2%, a difference of 0.19%), Immigrants from Brazil (5.2%, a difference of 0.30%), and Israeli (5.2%, a difference of 0.48%).
| Demographics | Rating | Rank | 4 or more Vehicles in Household |
| Brazilians | 0.3 /100 | #284 | Tragic 5.4% |
| Immigrants | Liberia | 0.2 /100 | #285 | Tragic 5.4% |
| Immigrants | Colombia | 0.2 /100 | #286 | Tragic 5.4% |
| Immigrants | Croatia | 0.2 /100 | #287 | Tragic 5.4% |
| Venezuelans | 0.2 /100 | #288 | Tragic 5.3% |
| Immigrants | Bosnia and Herzegovina | 0.2 /100 | #289 | Tragic 5.3% |
| Immigrants | Russia | 0.2 /100 | #290 | Tragic 5.3% |
| Immigrants | Bahamas | 0.1 /100 | #291 | Tragic 5.3% |
| Liberians | 0.1 /100 | #292 | Tragic 5.3% |
| Immigrants | Congo | 0.1 /100 | #293 | Tragic 5.2% |
| Ghanaians | 0.1 /100 | #294 | Tragic 5.2% |
| Immigrants | Brazil | 0.1 /100 | #295 | Tragic 5.2% |
| Israelis | 0.1 /100 | #296 | Tragic 5.2% |
| Immigrants | Venezuela | 0.1 /100 | #297 | Tragic 5.2% |
| Immigrants | South America | 0.1 /100 | #298 | Tragic 5.2% |
Demographics Similar to French by 4 or more Vehicles in Household
In terms of 4 or more vehicles in household, the demographic groups most similar to French are Filipino (6.9%, a difference of 0.18%), Nicaraguan (7.0%, a difference of 0.34%), Guatemalan (7.0%, a difference of 0.35%), German Russian (7.0%, a difference of 0.69%), and Immigrants from Thailand (6.9%, a difference of 0.69%).
| Demographics | Rating | Rank | 4 or more Vehicles in Household |
| Pakistanis | 98.7 /100 | #101 | Exceptional 7.0% |
| Asians | 98.6 /100 | #102 | Exceptional 7.0% |
| Blackfeet | 98.6 /100 | #103 | Exceptional 7.0% |
| Hmong | 98.3 /100 | #104 | Exceptional 7.0% |
| German Russians | 98.3 /100 | #105 | Exceptional 7.0% |
| Guatemalans | 98.1 /100 | #106 | Exceptional 7.0% |
| Nicaraguans | 98.0 /100 | #107 | Exceptional 7.0% |
| French | 97.7 /100 | #108 | Exceptional 6.9% |
| Filipinos | 97.6 /100 | #109 | Exceptional 6.9% |
| Immigrants | Thailand | 97.0 /100 | #110 | Exceptional 6.9% |
| Aleuts | 97.0 /100 | #111 | Exceptional 6.9% |
| Hopi | 97.0 /100 | #112 | Exceptional 6.9% |
| Canadians | 96.4 /100 | #113 | Exceptional 6.9% |
| Bolivians | 96.3 /100 | #114 | Exceptional 6.8% |
| Tlingit-Haida | 96.2 /100 | #115 | Exceptional 6.8% |