Immigrants from Bahamas vs Immigrants from Fiji 4 or more Vehicles in Household
COMPARE
Immigrants from Bahamas
Immigrants from Fiji
4 or more Vehicles in Household
4 or more Vehicles in Household Comparison
Immigrants from Bahamas
Immigrants from Fiji
5.3%
4 OR MORE VEHICLES IN HOUSEHOLD
0.1/ 100
METRIC RATING
291st/ 347
METRIC RANK
9.6%
4 OR MORE VEHICLES IN HOUSEHOLD
100.0/ 100
METRIC RATING
5th/ 347
METRIC RANK
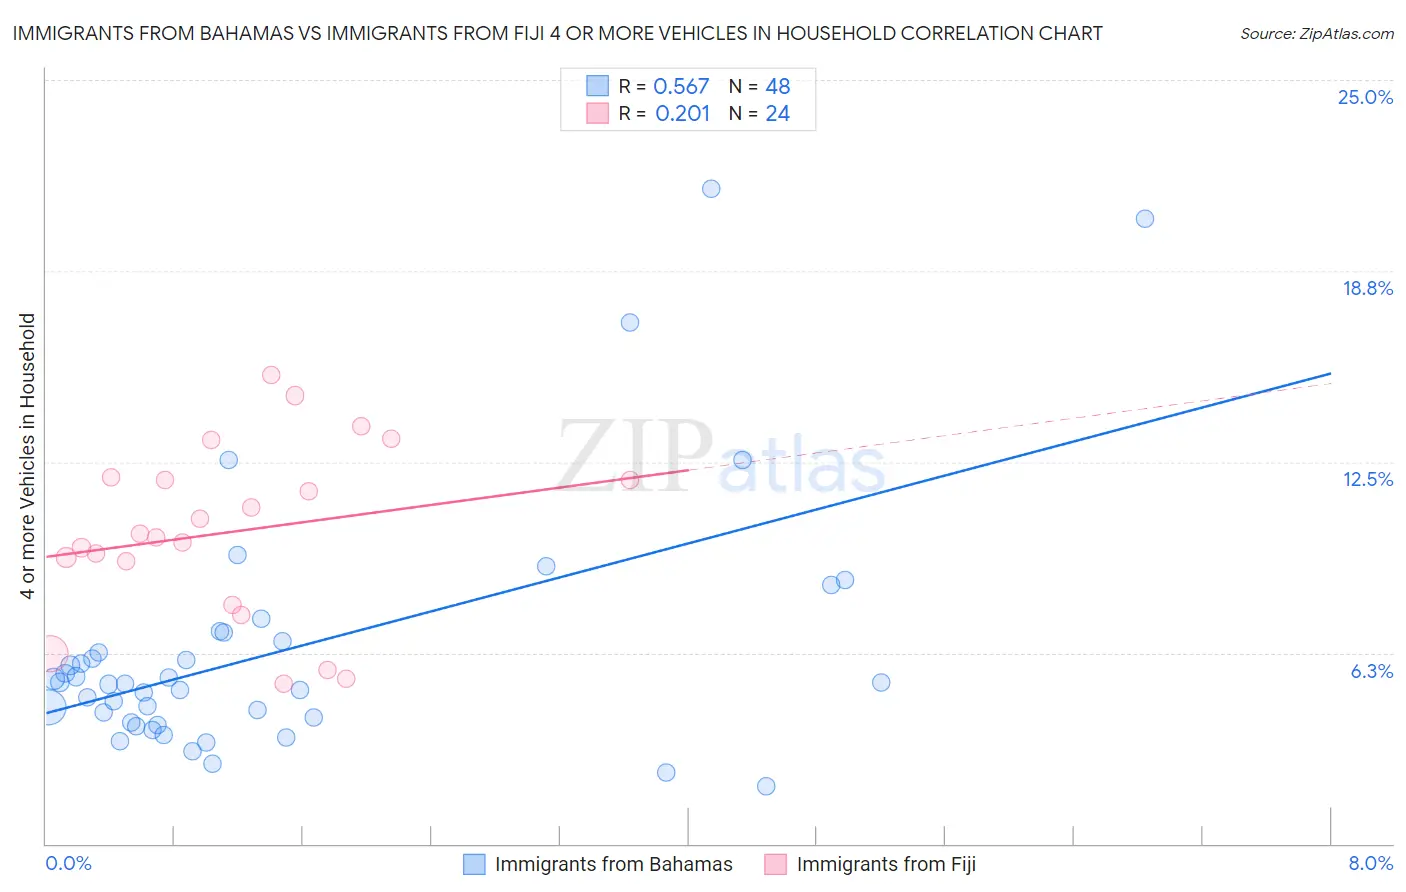
Immigrants from Bahamas vs Immigrants from Fiji 4 or more Vehicles in Household Correlation Chart
The statistical analysis conducted on geographies consisting of 104,355,564 people shows a substantial positive correlation between the proportion of Immigrants from Bahamas and percentage of households with 4 or more vehicles available in the United States with a correlation coefficient (R) of 0.567 and weighted average of 5.3%. Similarly, the statistical analysis conducted on geographies consisting of 93,730,930 people shows a weak positive correlation between the proportion of Immigrants from Fiji and percentage of households with 4 or more vehicles available in the United States with a correlation coefficient (R) of 0.201 and weighted average of 9.6%, a difference of 83.2%.
4 or more Vehicles in Household Correlation Summary
| Measurement | Immigrants from Bahamas | Immigrants from Fiji |
| Minimum | 1.9% | 5.2% |
| Maximum | 21.5% | 15.3% |
| Range | 19.6% | 10.1% |
| Mean | 6.4% | 10.2% |
| Median | 5.3% | 10.1% |
| Interquartile 25% (IQ1) | 4.1% | 8.5% |
| Interquartile 75% (IQ3) | 6.8% | 12.0% |
| Interquartile Range (IQR) | 2.7% | 3.4% |
| Standard Deviation (Sample) | 4.1% | 2.9% |
| Standard Deviation (Population) | 4.1% | 2.8% |
Similar Demographics by 4 or more Vehicles in Household
Demographics Similar to Immigrants from Bahamas by 4 or more Vehicles in Household
In terms of 4 or more vehicles in household, the demographic groups most similar to Immigrants from Bahamas are Liberian (5.3%, a difference of 0.10%), Immigrants from Congo (5.2%, a difference of 0.13%), Ghanaian (5.2%, a difference of 0.19%), Immigrants from Brazil (5.2%, a difference of 0.30%), and Israeli (5.2%, a difference of 0.48%).
| Demographics | Rating | Rank | 4 or more Vehicles in Household |
| Brazilians | 0.3 /100 | #284 | Tragic 5.4% |
| Immigrants | Liberia | 0.2 /100 | #285 | Tragic 5.4% |
| Immigrants | Colombia | 0.2 /100 | #286 | Tragic 5.4% |
| Immigrants | Croatia | 0.2 /100 | #287 | Tragic 5.4% |
| Venezuelans | 0.2 /100 | #288 | Tragic 5.3% |
| Immigrants | Bosnia and Herzegovina | 0.2 /100 | #289 | Tragic 5.3% |
| Immigrants | Russia | 0.2 /100 | #290 | Tragic 5.3% |
| Immigrants | Bahamas | 0.1 /100 | #291 | Tragic 5.3% |
| Liberians | 0.1 /100 | #292 | Tragic 5.3% |
| Immigrants | Congo | 0.1 /100 | #293 | Tragic 5.2% |
| Ghanaians | 0.1 /100 | #294 | Tragic 5.2% |
| Immigrants | Brazil | 0.1 /100 | #295 | Tragic 5.2% |
| Israelis | 0.1 /100 | #296 | Tragic 5.2% |
| Immigrants | Venezuela | 0.1 /100 | #297 | Tragic 5.2% |
| Immigrants | South America | 0.1 /100 | #298 | Tragic 5.2% |
Demographics Similar to Immigrants from Fiji by 4 or more Vehicles in Household
In terms of 4 or more vehicles in household, the demographic groups most similar to Immigrants from Fiji are Puget Sound Salish (9.4%, a difference of 2.5%), Native Hawaiian (9.4%, a difference of 2.6%), Arapaho (9.4%, a difference of 3.0%), Tongan (10.0%, a difference of 4.3%), and Samoan (9.2%, a difference of 4.4%).
| Demographics | Rating | Rank | 4 or more Vehicles in Household |
| Yakama | 100 /100 | #1 | Exceptional 12.9% |
| Colville | 100.0 /100 | #2 | Exceptional 11.1% |
| Spanish American Indians | 100.0 /100 | #3 | Exceptional 10.8% |
| Tongans | 100.0 /100 | #4 | Exceptional 10.0% |
| Immigrants | Fiji | 100.0 /100 | #5 | Exceptional 9.6% |
| Puget Sound Salish | 100.0 /100 | #6 | Exceptional 9.4% |
| Native Hawaiians | 100.0 /100 | #7 | Exceptional 9.4% |
| Arapaho | 100.0 /100 | #8 | Exceptional 9.4% |
| Samoans | 100.0 /100 | #9 | Exceptional 9.2% |
| Paiute | 100.0 /100 | #10 | Exceptional 9.0% |
| Immigrants | Mexico | 100.0 /100 | #11 | Exceptional 9.0% |
| Mexicans | 100.0 /100 | #12 | Exceptional 8.9% |
| Hawaiians | 100.0 /100 | #13 | Exceptional 8.9% |
| Chinese | 100.0 /100 | #14 | Exceptional 8.8% |
| Shoshone | 100.0 /100 | #15 | Exceptional 8.8% |