Immigrants from Bahamas vs Guatemalan 1st Grade
COMPARE
Immigrants from Bahamas
Guatemalan
1st Grade
1st Grade Comparison
Immigrants from Bahamas
Guatemalans
97.7%
1ST GRADE
8.1/ 100
METRIC RATING
213th/ 347
METRIC RANK
96.5%
1ST GRADE
0.0/ 100
METRIC RATING
336th/ 347
METRIC RANK
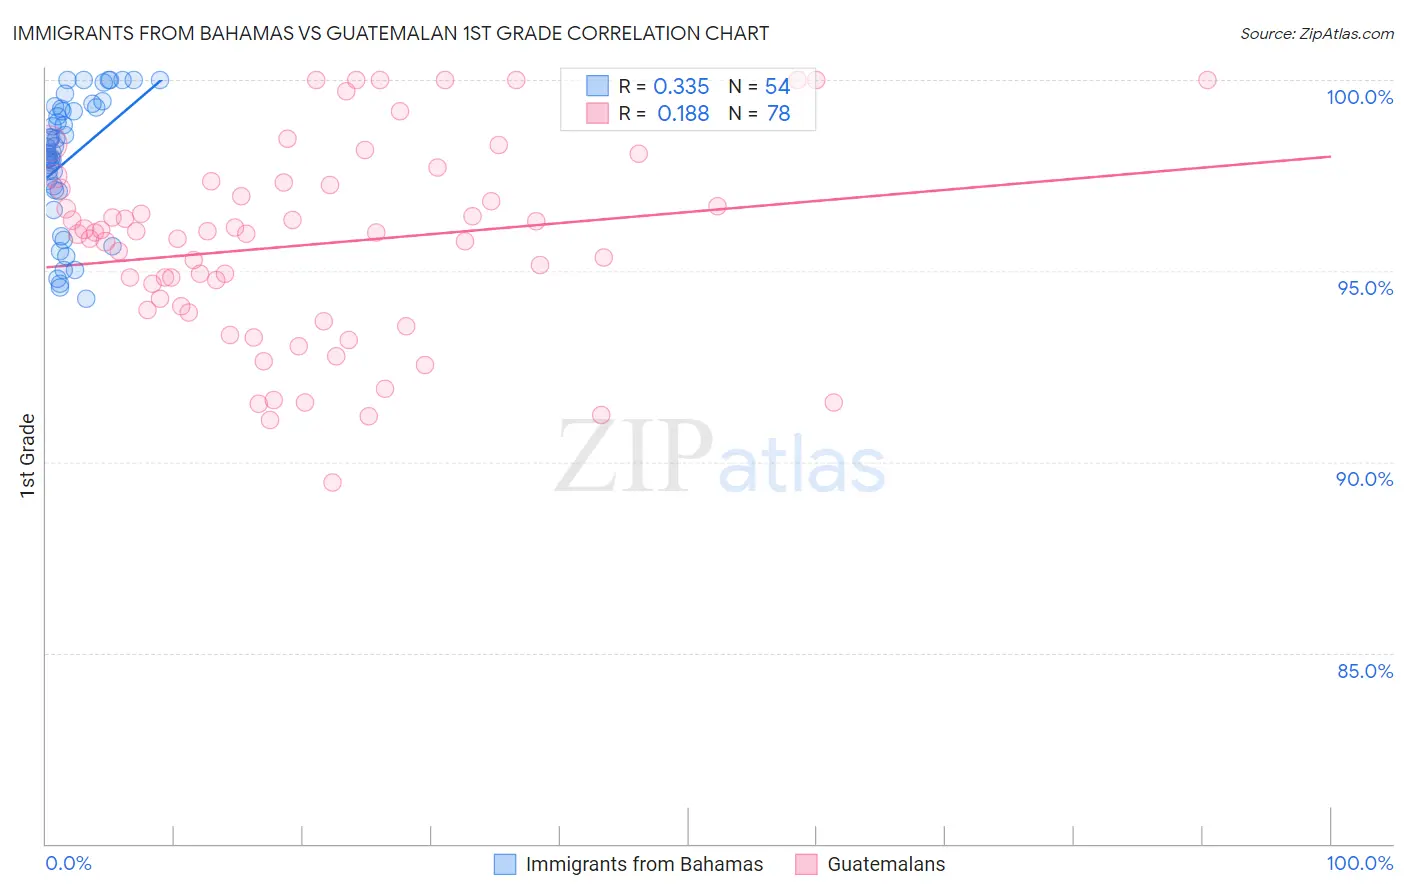
Immigrants from Bahamas vs Guatemalan 1st Grade Correlation Chart
The statistical analysis conducted on geographies consisting of 104,666,627 people shows a mild positive correlation between the proportion of Immigrants from Bahamas and percentage of population with at least 1st grade education in the United States with a correlation coefficient (R) of 0.335 and weighted average of 97.7%. Similarly, the statistical analysis conducted on geographies consisting of 409,566,469 people shows a poor positive correlation between the proportion of Guatemalans and percentage of population with at least 1st grade education in the United States with a correlation coefficient (R) of 0.188 and weighted average of 96.5%, a difference of 1.3%.
1st Grade Correlation Summary
| Measurement | Immigrants from Bahamas | Guatemalan |
| Minimum | 94.3% | 89.4% |
| Maximum | 100.0% | 100.0% |
| Range | 5.7% | 10.6% |
| Mean | 97.9% | 95.7% |
| Median | 98.2% | 96.0% |
| Interquartile 25% (IQ1) | 97.1% | 94.0% |
| Interquartile 75% (IQ3) | 99.2% | 97.2% |
| Interquartile Range (IQR) | 2.1% | 3.3% |
| Standard Deviation (Sample) | 1.7% | 2.5% |
| Standard Deviation (Population) | 1.7% | 2.5% |
Similar Demographics by 1st Grade
Demographics Similar to Immigrants from Bahamas by 1st Grade
In terms of 1st grade, the demographic groups most similar to Immigrants from Bahamas are Moroccan (97.7%, a difference of 0.010%), South American Indian (97.7%, a difference of 0.010%), Bahamian (97.7%, a difference of 0.010%), Uruguayan (97.7%, a difference of 0.010%), and Samoan (97.7%, a difference of 0.010%).
| Demographics | Rating | Rank | 1st Grade |
| Immigrants | Albania | 17.3 /100 | #206 | Poor 97.8% |
| Africans | 16.5 /100 | #207 | Poor 97.8% |
| Immigrants | Northern Africa | 12.0 /100 | #208 | Poor 97.8% |
| Costa Ricans | 11.6 /100 | #209 | Poor 97.8% |
| Immigrants | Oceania | 11.0 /100 | #210 | Poor 97.8% |
| Laotians | 10.3 /100 | #211 | Poor 97.8% |
| Moroccans | 8.7 /100 | #212 | Tragic 97.7% |
| Immigrants | Bahamas | 8.1 /100 | #213 | Tragic 97.7% |
| South American Indians | 7.6 /100 | #214 | Tragic 97.7% |
| Bahamians | 7.5 /100 | #215 | Tragic 97.7% |
| Uruguayans | 7.4 /100 | #216 | Tragic 97.7% |
| Samoans | 6.8 /100 | #217 | Tragic 97.7% |
| Immigrants | Morocco | 5.3 /100 | #218 | Tragic 97.7% |
| Immigrants | Panama | 5.2 /100 | #219 | Tragic 97.7% |
| Tongans | 4.6 /100 | #220 | Tragic 97.7% |
Demographics Similar to Guatemalans by 1st Grade
In terms of 1st grade, the demographic groups most similar to Guatemalans are Yakama (96.5%, a difference of 0.020%), Bangladeshi (96.5%, a difference of 0.040%), Immigrants from Cambodia (96.5%, a difference of 0.040%), Immigrants from Dominican Republic (96.5%, a difference of 0.050%), and Immigrants from Fiji (96.4%, a difference of 0.050%).
| Demographics | Rating | Rank | 1st Grade |
| Japanese | 0.0 /100 | #329 | Tragic 96.6% |
| Immigrants | Vietnam | 0.0 /100 | #330 | Tragic 96.6% |
| Immigrants | Armenia | 0.0 /100 | #331 | Tragic 96.6% |
| Central Americans | 0.0 /100 | #332 | Tragic 96.5% |
| Immigrants | Dominican Republic | 0.0 /100 | #333 | Tragic 96.5% |
| Bangladeshis | 0.0 /100 | #334 | Tragic 96.5% |
| Yakama | 0.0 /100 | #335 | Tragic 96.5% |
| Guatemalans | 0.0 /100 | #336 | Tragic 96.5% |
| Immigrants | Cambodia | 0.0 /100 | #337 | Tragic 96.5% |
| Immigrants | Fiji | 0.0 /100 | #338 | Tragic 96.4% |
| Immigrants | Guatemala | 0.0 /100 | #339 | Tragic 96.4% |
| Immigrants | Cabo Verde | 0.0 /100 | #340 | Tragic 96.3% |
| Immigrants | Central America | 0.0 /100 | #341 | Tragic 96.3% |
| Immigrants | Mexico | 0.0 /100 | #342 | Tragic 96.3% |
| Salvadorans | 0.0 /100 | #343 | Tragic 96.3% |