Immigrants from Australia vs Immigrants from India 1 or more Vehicles in Household
COMPARE
Immigrants from Australia
Immigrants from India
1 or more Vehicles in Household
1 or more Vehicles in Household Comparison
Immigrants from Australia
Immigrants from India
86.4%
1 OR MORE VEHICLES IN HOUSEHOLD
0.0/ 100
METRIC RATING
290th/ 347
METRIC RANK
91.9%
1 OR MORE VEHICLES IN HOUSEHOLD
99.8/ 100
METRIC RATING
61st/ 347
METRIC RANK
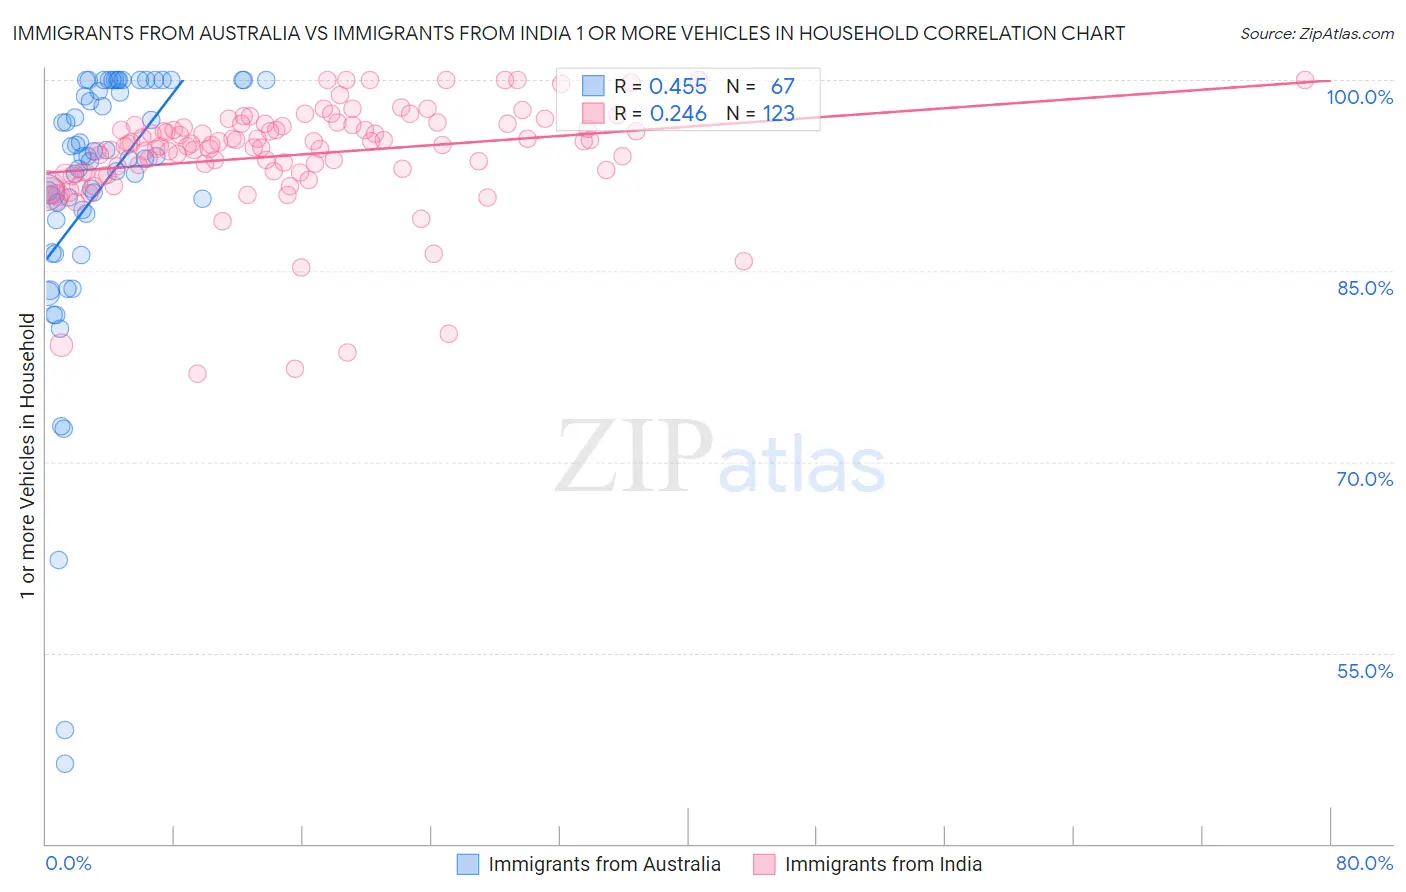
Immigrants from Australia vs Immigrants from India 1 or more Vehicles in Household Correlation Chart
The statistical analysis conducted on geographies consisting of 227,104,870 people shows a moderate positive correlation between the proportion of Immigrants from Australia and percentage of households with 1 or more vehicles available in the United States with a correlation coefficient (R) of 0.455 and weighted average of 86.4%. Similarly, the statistical analysis conducted on geographies consisting of 433,708,630 people shows a weak positive correlation between the proportion of Immigrants from India and percentage of households with 1 or more vehicles available in the United States with a correlation coefficient (R) of 0.246 and weighted average of 91.9%, a difference of 6.4%.
1 or more Vehicles in Household Correlation Summary
| Measurement | Immigrants from Australia | Immigrants from India |
| Minimum | 46.3% | 76.9% |
| Maximum | 100.0% | 100.0% |
| Range | 53.7% | 23.1% |
| Mean | 91.4% | 94.1% |
| Median | 94.0% | 94.9% |
| Interquartile 25% (IQ1) | 89.4% | 92.7% |
| Interquartile 75% (IQ3) | 100.0% | 96.5% |
| Interquartile Range (IQR) | 10.6% | 3.7% |
| Standard Deviation (Sample) | 10.9% | 4.3% |
| Standard Deviation (Population) | 10.8% | 4.3% |
Similar Demographics by 1 or more Vehicles in Household
Demographics Similar to Immigrants from Australia by 1 or more Vehicles in Household
In terms of 1 or more vehicles in household, the demographic groups most similar to Immigrants from Australia are Immigrants from Ireland (86.4%, a difference of 0.040%), Hopi (86.4%, a difference of 0.060%), Pima (86.3%, a difference of 0.080%), Immigrants from Malaysia (86.5%, a difference of 0.13%), and Immigrants from Eastern Asia (86.5%, a difference of 0.21%).
| Demographics | Rating | Rank | 1 or more Vehicles in Household |
| Immigrants | Eastern Europe | 0.0 /100 | #283 | Tragic 86.7% |
| Central American Indians | 0.0 /100 | #284 | Tragic 86.7% |
| Immigrants | Kazakhstan | 0.0 /100 | #285 | Tragic 86.6% |
| Immigrants | Eastern Asia | 0.0 /100 | #286 | Tragic 86.5% |
| Immigrants | Malaysia | 0.0 /100 | #287 | Tragic 86.5% |
| Hopi | 0.0 /100 | #288 | Tragic 86.4% |
| Immigrants | Ireland | 0.0 /100 | #289 | Tragic 86.4% |
| Immigrants | Australia | 0.0 /100 | #290 | Tragic 86.4% |
| Pima | 0.0 /100 | #291 | Tragic 86.3% |
| Okinawans | 0.0 /100 | #292 | Tragic 86.1% |
| Indians (Asian) | 0.0 /100 | #293 | Tragic 86.0% |
| Alaskan Athabascans | 0.0 /100 | #294 | Tragic 86.0% |
| Immigrants | Jamaica | 0.0 /100 | #295 | Tragic 85.8% |
| Immigrants | Spain | 0.0 /100 | #296 | Tragic 85.8% |
| Paraguayans | 0.0 /100 | #297 | Tragic 85.7% |
Demographics Similar to Immigrants from India by 1 or more Vehicles in Household
In terms of 1 or more vehicles in household, the demographic groups most similar to Immigrants from India are Thai (91.9%, a difference of 0.0%), Slovak (91.9%, a difference of 0.010%), Chinese (91.9%, a difference of 0.030%), Croatian (91.9%, a difference of 0.030%), and Venezuelan (91.9%, a difference of 0.040%).
| Demographics | Rating | Rank | 1 or more Vehicles in Household |
| Slovenes | 99.9 /100 | #54 | Exceptional 92.0% |
| Immigrants | Afghanistan | 99.9 /100 | #55 | Exceptional 92.0% |
| Immigrants | Venezuela | 99.9 /100 | #56 | Exceptional 92.0% |
| Iraqis | 99.8 /100 | #57 | Exceptional 91.9% |
| Immigrants | Mexico | 99.8 /100 | #58 | Exceptional 91.9% |
| Venezuelans | 99.8 /100 | #59 | Exceptional 91.9% |
| Slovaks | 99.8 /100 | #60 | Exceptional 91.9% |
| Immigrants | India | 99.8 /100 | #61 | Exceptional 91.9% |
| Thais | 99.8 /100 | #62 | Exceptional 91.9% |
| Chinese | 99.8 /100 | #63 | Exceptional 91.9% |
| Croatians | 99.8 /100 | #64 | Exceptional 91.9% |
| Immigrants | Laos | 99.8 /100 | #65 | Exceptional 91.8% |
| Canadians | 99.8 /100 | #66 | Exceptional 91.8% |
| Spaniards | 99.8 /100 | #67 | Exceptional 91.8% |
| Immigrants | Scotland | 99.7 /100 | #68 | Exceptional 91.8% |