Immigrants from Australia vs Immigrants from India Unemployment Among Ages 45 to 54 years
COMPARE
Immigrants from Australia
Immigrants from India
Unemployment Among Ages 45 to 54 years
Unemployment Among Ages 45 to 54 years Comparison
Immigrants from Australia
Immigrants from India
4.5%
UNEMPLOYMENT AMONG AGES 45 TO 54 YEARS
48.5/ 100
METRIC RATING
178th/ 347
METRIC RANK
3.9%
UNEMPLOYMENT AMONG AGES 45 TO 54 YEARS
100.0/ 100
METRIC RATING
4th/ 347
METRIC RANK
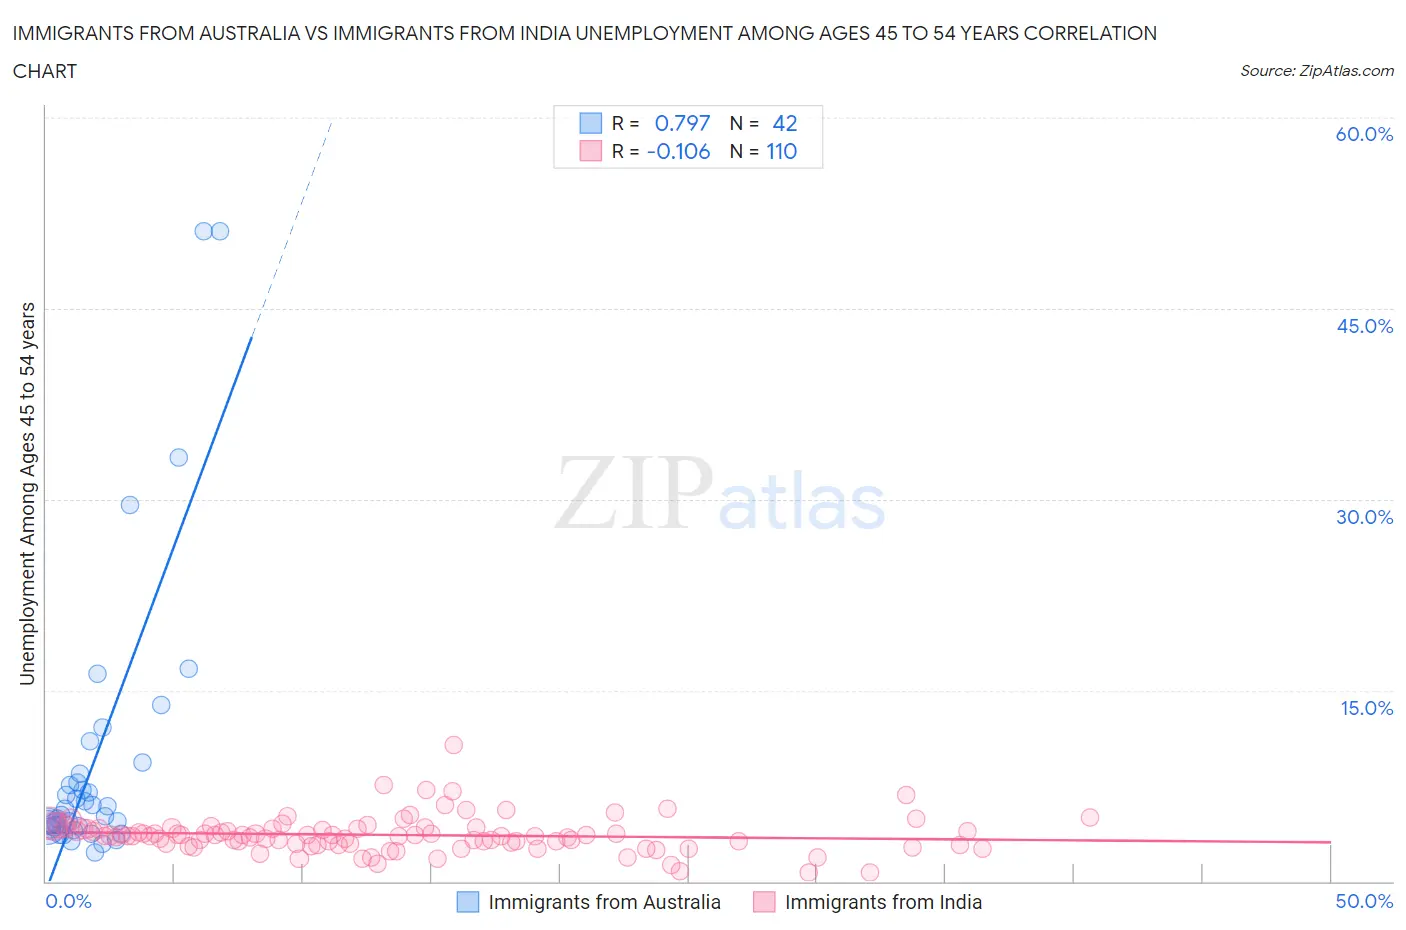
Immigrants from Australia vs Immigrants from India Unemployment Among Ages 45 to 54 years Correlation Chart
The statistical analysis conducted on geographies consisting of 223,893,284 people shows a strong positive correlation between the proportion of Immigrants from Australia and unemployment rate among population between the ages 45 and 54 in the United States with a correlation coefficient (R) of 0.797 and weighted average of 4.5%. Similarly, the statistical analysis conducted on geographies consisting of 421,870,941 people shows a poor negative correlation between the proportion of Immigrants from India and unemployment rate among population between the ages 45 and 54 in the United States with a correlation coefficient (R) of -0.106 and weighted average of 3.9%, a difference of 16.5%.
Unemployment Among Ages 45 to 54 years Correlation Summary
| Measurement | Immigrants from Australia | Immigrants from India |
| Minimum | 2.2% | 0.70% |
| Maximum | 51.1% | 10.7% |
| Range | 48.9% | 10.0% |
| Mean | 9.6% | 3.6% |
| Median | 5.4% | 3.6% |
| Interquartile 25% (IQ1) | 4.3% | 2.9% |
| Interquartile 75% (IQ3) | 8.5% | 4.1% |
| Interquartile Range (IQR) | 4.2% | 1.2% |
| Standard Deviation (Sample) | 11.3% | 1.4% |
| Standard Deviation (Population) | 11.2% | 1.4% |
Similar Demographics by Unemployment Among Ages 45 to 54 years
Demographics Similar to Immigrants from Australia by Unemployment Among Ages 45 to 54 years
In terms of unemployment among ages 45 to 54 years, the demographic groups most similar to Immigrants from Australia are Immigrants from Russia (4.5%, a difference of 0.010%), Immigrants from Northern Africa (4.5%, a difference of 0.020%), Puget Sound Salish (4.5%, a difference of 0.030%), Immigrants from France (4.5%, a difference of 0.040%), and Malaysian (4.5%, a difference of 0.050%).
| Demographics | Rating | Rank | Unemployment Among Ages 45 to 54 years |
| Egyptians | 53.6 /100 | #171 | Average 4.5% |
| Colombians | 53.3 /100 | #172 | Average 4.5% |
| Immigrants | Colombia | 52.0 /100 | #173 | Average 4.5% |
| Immigrants | Hungary | 50.0 /100 | #174 | Average 4.5% |
| Immigrants | France | 49.4 /100 | #175 | Average 4.5% |
| Puget Sound Salish | 49.1 /100 | #176 | Average 4.5% |
| Immigrants | Northern Africa | 49.0 /100 | #177 | Average 4.5% |
| Immigrants | Australia | 48.5 /100 | #178 | Average 4.5% |
| Immigrants | Russia | 48.2 /100 | #179 | Average 4.5% |
| Malaysians | 47.5 /100 | #180 | Average 4.5% |
| Immigrants | Poland | 47.0 /100 | #181 | Average 4.5% |
| Immigrants | China | 46.7 /100 | #182 | Average 4.5% |
| Sierra Leoneans | 46.7 /100 | #183 | Average 4.5% |
| Immigrants | Hong Kong | 45.9 /100 | #184 | Average 4.5% |
| Immigrants | Philippines | 41.0 /100 | #185 | Average 4.5% |
Demographics Similar to Immigrants from India by Unemployment Among Ages 45 to 54 years
In terms of unemployment among ages 45 to 54 years, the demographic groups most similar to Immigrants from India are Danish (3.9%, a difference of 0.17%), Immigrants from Cuba (3.9%, a difference of 0.39%), Norwegian (3.9%, a difference of 0.87%), Immigrants from Venezuela (3.9%, a difference of 1.6%), and Chinese (4.0%, a difference of 2.0%).
| Demographics | Rating | Rank | Unemployment Among Ages 45 to 54 years |
| Hmong | 100.0 /100 | #1 | Exceptional 3.7% |
| Fijians | 100.0 /100 | #2 | Exceptional 3.8% |
| Norwegians | 100.0 /100 | #3 | Exceptional 3.9% |
| Immigrants | India | 100.0 /100 | #4 | Exceptional 3.9% |
| Danes | 100.0 /100 | #5 | Exceptional 3.9% |
| Immigrants | Cuba | 100.0 /100 | #6 | Exceptional 3.9% |
| Immigrants | Venezuela | 100.0 /100 | #7 | Exceptional 3.9% |
| Chinese | 100.0 /100 | #8 | Exceptional 4.0% |
| Czechs | 100.0 /100 | #9 | Exceptional 4.0% |
| Venezuelans | 100.0 /100 | #10 | Exceptional 4.0% |
| Scandinavians | 100.0 /100 | #11 | Exceptional 4.0% |
| Swedes | 100.0 /100 | #12 | Exceptional 4.0% |
| Cubans | 100.0 /100 | #13 | Exceptional 4.0% |
| Immigrants | Bosnia and Herzegovina | 100.0 /100 | #14 | Exceptional 4.0% |
| Immigrants | Bolivia | 100.0 /100 | #15 | Exceptional 4.0% |