Immigrants from Australia vs Estonian 1 or more Vehicles in Household
COMPARE
Immigrants from Australia
Estonian
1 or more Vehicles in Household
1 or more Vehicles in Household Comparison
Immigrants from Australia
Estonians
86.4%
1 OR MORE VEHICLES IN HOUSEHOLD
0.0/ 100
METRIC RATING
290th/ 347
METRIC RANK
90.3%
1 OR MORE VEHICLES IN HOUSEHOLD
85.6/ 100
METRIC RATING
139th/ 347
METRIC RANK
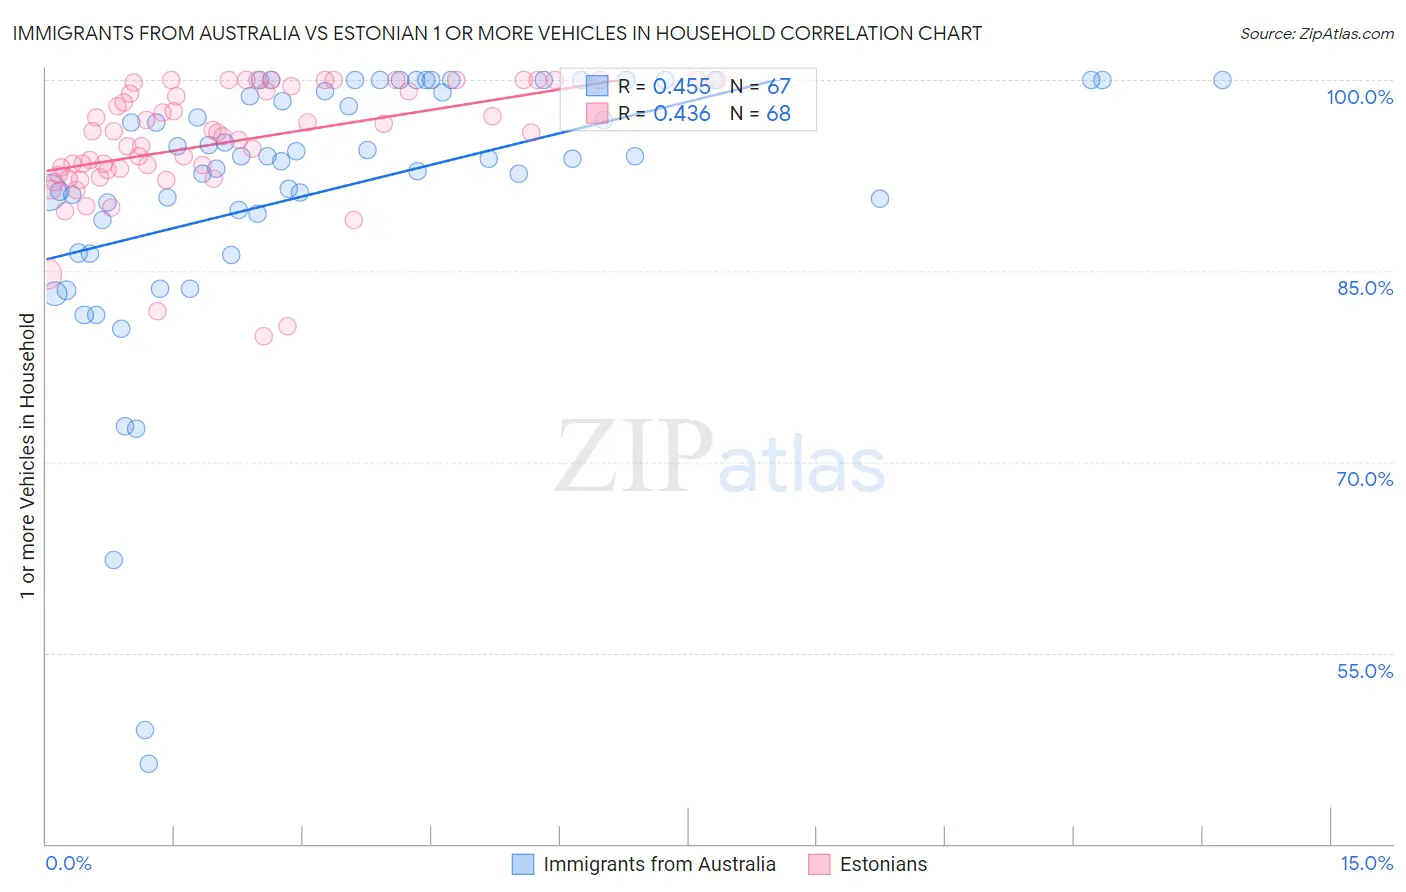
Immigrants from Australia vs Estonian 1 or more Vehicles in Household Correlation Chart
The statistical analysis conducted on geographies consisting of 227,104,870 people shows a moderate positive correlation between the proportion of Immigrants from Australia and percentage of households with 1 or more vehicles available in the United States with a correlation coefficient (R) of 0.455 and weighted average of 86.4%. Similarly, the statistical analysis conducted on geographies consisting of 123,503,955 people shows a moderate positive correlation between the proportion of Estonians and percentage of households with 1 or more vehicles available in the United States with a correlation coefficient (R) of 0.436 and weighted average of 90.3%, a difference of 4.6%.
1 or more Vehicles in Household Correlation Summary
| Measurement | Immigrants from Australia | Estonian |
| Minimum | 46.3% | 79.9% |
| Maximum | 100.0% | 100.0% |
| Range | 53.7% | 20.1% |
| Mean | 91.4% | 95.1% |
| Median | 94.0% | 95.9% |
| Interquartile 25% (IQ1) | 89.4% | 92.7% |
| Interquartile 75% (IQ3) | 100.0% | 99.4% |
| Interquartile Range (IQR) | 10.6% | 6.6% |
| Standard Deviation (Sample) | 10.9% | 4.7% |
| Standard Deviation (Population) | 10.8% | 4.6% |
Similar Demographics by 1 or more Vehicles in Household
Demographics Similar to Immigrants from Australia by 1 or more Vehicles in Household
In terms of 1 or more vehicles in household, the demographic groups most similar to Immigrants from Australia are Immigrants from Ireland (86.4%, a difference of 0.040%), Hopi (86.4%, a difference of 0.060%), Pima (86.3%, a difference of 0.080%), Immigrants from Malaysia (86.5%, a difference of 0.13%), and Immigrants from Eastern Asia (86.5%, a difference of 0.21%).
| Demographics | Rating | Rank | 1 or more Vehicles in Household |
| Immigrants | Eastern Europe | 0.0 /100 | #283 | Tragic 86.7% |
| Central American Indians | 0.0 /100 | #284 | Tragic 86.7% |
| Immigrants | Kazakhstan | 0.0 /100 | #285 | Tragic 86.6% |
| Immigrants | Eastern Asia | 0.0 /100 | #286 | Tragic 86.5% |
| Immigrants | Malaysia | 0.0 /100 | #287 | Tragic 86.5% |
| Hopi | 0.0 /100 | #288 | Tragic 86.4% |
| Immigrants | Ireland | 0.0 /100 | #289 | Tragic 86.4% |
| Immigrants | Australia | 0.0 /100 | #290 | Tragic 86.4% |
| Pima | 0.0 /100 | #291 | Tragic 86.3% |
| Okinawans | 0.0 /100 | #292 | Tragic 86.1% |
| Indians (Asian) | 0.0 /100 | #293 | Tragic 86.0% |
| Alaskan Athabascans | 0.0 /100 | #294 | Tragic 86.0% |
| Immigrants | Jamaica | 0.0 /100 | #295 | Tragic 85.8% |
| Immigrants | Spain | 0.0 /100 | #296 | Tragic 85.8% |
| Paraguayans | 0.0 /100 | #297 | Tragic 85.7% |
Demographics Similar to Estonians by 1 or more Vehicles in Household
In terms of 1 or more vehicles in household, the demographic groups most similar to Estonians are Sudanese (90.3%, a difference of 0.010%), Latvian (90.3%, a difference of 0.020%), Syrian (90.3%, a difference of 0.020%), Hungarian (90.3%, a difference of 0.030%), and Kenyan (90.4%, a difference of 0.040%).
| Demographics | Rating | Rank | 1 or more Vehicles in Household |
| Immigrants | South Africa | 88.1 /100 | #132 | Excellent 90.4% |
| Immigrants | Syria | 87.5 /100 | #133 | Excellent 90.4% |
| Kenyans | 87.0 /100 | #134 | Excellent 90.4% |
| Immigrants | Oceania | 86.9 /100 | #135 | Excellent 90.4% |
| Hungarians | 86.5 /100 | #136 | Excellent 90.3% |
| Latvians | 86.3 /100 | #137 | Excellent 90.3% |
| Syrians | 86.3 /100 | #138 | Excellent 90.3% |
| Estonians | 85.6 /100 | #139 | Excellent 90.3% |
| Sudanese | 85.2 /100 | #140 | Excellent 90.3% |
| Immigrants | Moldova | 83.1 /100 | #141 | Excellent 90.2% |
| Immigrants | Lithuania | 83.0 /100 | #142 | Excellent 90.2% |
| Immigrants | Bahamas | 81.5 /100 | #143 | Excellent 90.2% |
| Immigrants | Zimbabwe | 81.5 /100 | #144 | Excellent 90.2% |
| Sioux | 81.3 /100 | #145 | Excellent 90.2% |
| Bahamians | 80.5 /100 | #146 | Excellent 90.2% |