Immigrants from Australia vs Immigrants from India Householder Income Ages 25 - 44 years
COMPARE
Immigrants from Australia
Immigrants from India
Householder Income Ages 25 - 44 years
Householder Income Ages 25 - 44 years Comparison
Immigrants from Australia
Immigrants from India
$115,947
HOUSEHOLDER INCOME AGES 25 - 44 YEARS
100.0/ 100
METRIC RATING
17th/ 347
METRIC RANK
$124,238
HOUSEHOLDER INCOME AGES 25 - 44 YEARS
100.0/ 100
METRIC RATING
5th/ 347
METRIC RANK
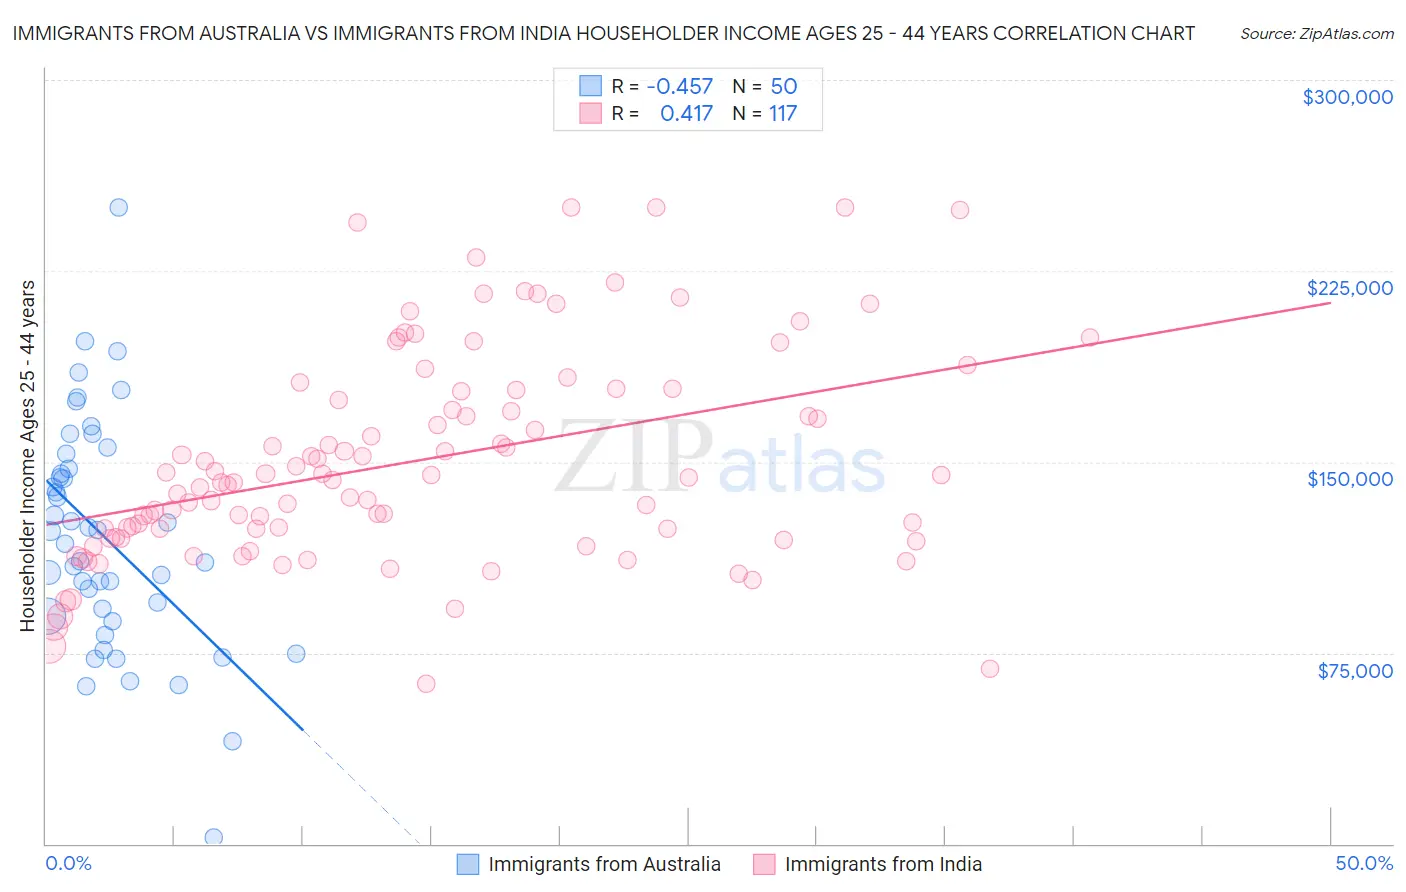
Immigrants from Australia vs Immigrants from India Householder Income Ages 25 - 44 years Correlation Chart
The statistical analysis conducted on geographies consisting of 226,902,734 people shows a moderate negative correlation between the proportion of Immigrants from Australia and household income with householder between the ages 25 and 44 in the United States with a correlation coefficient (R) of -0.457 and weighted average of $115,947. Similarly, the statistical analysis conducted on geographies consisting of 432,826,792 people shows a moderate positive correlation between the proportion of Immigrants from India and household income with householder between the ages 25 and 44 in the United States with a correlation coefficient (R) of 0.417 and weighted average of $124,238, a difference of 7.1%.
Householder Income Ages 25 - 44 years Correlation Summary
| Measurement | Immigrants from Australia | Immigrants from India |
| Minimum | $2,499 | $63,072 |
| Maximum | $250,001 | $250,001 |
| Range | $247,502 | $186,929 |
| Mean | $120,207 | $150,115 |
| Median | $120,330 | $143,110 |
| Interquartile 25% (IQ1) | $89,211 | $120,254 |
| Interquartile 75% (IQ3) | $147,110 | $177,993 |
| Interquartile Range (IQR) | $57,899 | $57,739 |
| Standard Deviation (Sample) | $45,319 | $41,287 |
| Standard Deviation (Population) | $44,864 | $41,110 |
Demographics Similar to Immigrants from Australia and Immigrants from India by Householder Income Ages 25 - 44 years
In terms of householder income ages 25 - 44 years, the demographic groups most similar to Immigrants from Australia are Cypriot ($116,364, a difference of 0.36%), Immigrants from South Central Asia ($116,626, a difference of 0.59%), Immigrants from Israel ($117,219, a difference of 1.1%), Eastern European ($114,523, a difference of 1.2%), and Immigrants from Eastern Asia ($118,056, a difference of 1.8%). Similarly, the demographic groups most similar to Immigrants from India are Immigrants from Singapore ($124,429, a difference of 0.15%), Thai ($121,778, a difference of 2.0%), Immigrants from Hong Kong ($128,140, a difference of 3.1%), Immigrants from Ireland ($120,333, a difference of 3.3%), and Iranian ($120,292, a difference of 3.3%).
| Demographics | Rating | Rank | Householder Income Ages 25 - 44 years |
| Immigrants | Taiwan | 100.0 /100 | #1 | Exceptional $129,122 |
| Filipinos | 100.0 /100 | #2 | Exceptional $128,723 |
| Immigrants | Hong Kong | 100.0 /100 | #3 | Exceptional $128,140 |
| Immigrants | Singapore | 100.0 /100 | #4 | Exceptional $124,429 |
| Immigrants | India | 100.0 /100 | #5 | Exceptional $124,238 |
| Thais | 100.0 /100 | #6 | Exceptional $121,778 |
| Immigrants | Ireland | 100.0 /100 | #7 | Exceptional $120,333 |
| Iranians | 100.0 /100 | #8 | Exceptional $120,292 |
| Immigrants | China | 100.0 /100 | #9 | Exceptional $119,756 |
| Indians (Asian) | 100.0 /100 | #10 | Exceptional $119,496 |
| Okinawans | 100.0 /100 | #11 | Exceptional $119,349 |
| Immigrants | Iran | 100.0 /100 | #12 | Exceptional $119,204 |
| Immigrants | Eastern Asia | 100.0 /100 | #13 | Exceptional $118,056 |
| Immigrants | Israel | 100.0 /100 | #14 | Exceptional $117,219 |
| Immigrants | South Central Asia | 100.0 /100 | #15 | Exceptional $116,626 |
| Cypriots | 100.0 /100 | #16 | Exceptional $116,364 |
| Immigrants | Australia | 100.0 /100 | #17 | Exceptional $115,947 |
| Eastern Europeans | 100.0 /100 | #18 | Exceptional $114,523 |
| Burmese | 100.0 /100 | #19 | Exceptional $113,701 |
| Immigrants | Korea | 100.0 /100 | #20 | Exceptional $113,401 |
| Asians | 100.0 /100 | #21 | Exceptional $112,666 |