Immigrants from Australia vs Immigrants from Singapore 1 or more Vehicles in Household
COMPARE
Immigrants from Australia
Immigrants from Singapore
1 or more Vehicles in Household
1 or more Vehicles in Household Comparison
Immigrants from Australia
Immigrants from Singapore
86.4%
1 OR MORE VEHICLES IN HOUSEHOLD
0.0/ 100
METRIC RATING
290th/ 347
METRIC RANK
87.2%
1 OR MORE VEHICLES IN HOUSEHOLD
0.1/ 100
METRIC RATING
275th/ 347
METRIC RANK
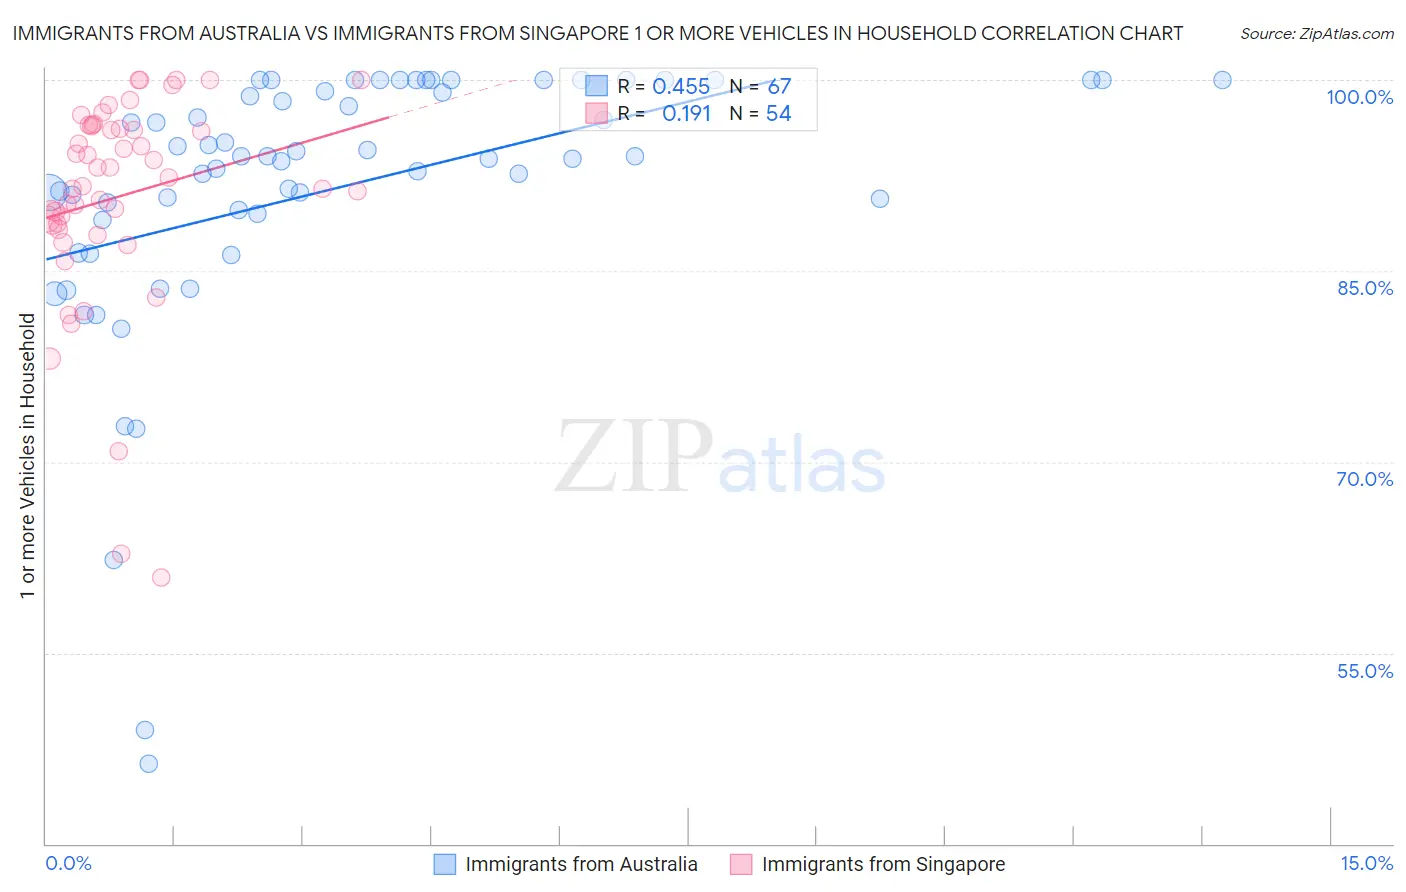
Immigrants from Australia vs Immigrants from Singapore 1 or more Vehicles in Household Correlation Chart
The statistical analysis conducted on geographies consisting of 227,104,870 people shows a moderate positive correlation between the proportion of Immigrants from Australia and percentage of households with 1 or more vehicles available in the United States with a correlation coefficient (R) of 0.455 and weighted average of 86.4%. Similarly, the statistical analysis conducted on geographies consisting of 137,467,600 people shows a poor positive correlation between the proportion of Immigrants from Singapore and percentage of households with 1 or more vehicles available in the United States with a correlation coefficient (R) of 0.191 and weighted average of 87.2%, a difference of 0.98%.
1 or more Vehicles in Household Correlation Summary
| Measurement | Immigrants from Australia | Immigrants from Singapore |
| Minimum | 46.3% | 60.9% |
| Maximum | 100.0% | 100.0% |
| Range | 53.7% | 39.1% |
| Mean | 91.4% | 90.8% |
| Median | 94.0% | 92.0% |
| Interquartile 25% (IQ1) | 89.4% | 88.6% |
| Interquartile 75% (IQ3) | 100.0% | 96.4% |
| Interquartile Range (IQR) | 10.6% | 7.8% |
| Standard Deviation (Sample) | 10.9% | 8.3% |
| Standard Deviation (Population) | 10.8% | 8.3% |
Demographics Similar to Immigrants from Australia and Immigrants from Singapore by 1 or more Vehicles in Household
In terms of 1 or more vehicles in household, the demographic groups most similar to Immigrants from Australia are Immigrants from Ireland (86.4%, a difference of 0.040%), Hopi (86.4%, a difference of 0.060%), Pima (86.3%, a difference of 0.080%), Immigrants from Malaysia (86.5%, a difference of 0.13%), and Immigrants from Eastern Asia (86.5%, a difference of 0.21%). Similarly, the demographic groups most similar to Immigrants from Singapore are Immigrants from France (87.1%, a difference of 0.070%), Alsatian (87.1%, a difference of 0.13%), Immigrants from Southern Europe (87.1%, a difference of 0.17%), Immigrants from Albania (87.1%, a difference of 0.17%), and Immigrants from Croatia (87.0%, a difference of 0.20%).
| Demographics | Rating | Rank | 1 or more Vehicles in Household |
| Aleuts | 0.2 /100 | #272 | Tragic 87.5% |
| Immigrants | Northern Africa | 0.2 /100 | #273 | Tragic 87.4% |
| Immigrants | Morocco | 0.1 /100 | #274 | Tragic 87.4% |
| Immigrants | Singapore | 0.1 /100 | #275 | Tragic 87.2% |
| Immigrants | France | 0.1 /100 | #276 | Tragic 87.1% |
| Alsatians | 0.1 /100 | #277 | Tragic 87.1% |
| Immigrants | Southern Europe | 0.1 /100 | #278 | Tragic 87.1% |
| Immigrants | Albania | 0.1 /100 | #279 | Tragic 87.1% |
| Immigrants | Croatia | 0.0 /100 | #280 | Tragic 87.0% |
| Mongolians | 0.0 /100 | #281 | Tragic 87.0% |
| Colville | 0.0 /100 | #282 | Tragic 86.8% |
| Immigrants | Eastern Europe | 0.0 /100 | #283 | Tragic 86.7% |
| Central American Indians | 0.0 /100 | #284 | Tragic 86.7% |
| Immigrants | Kazakhstan | 0.0 /100 | #285 | Tragic 86.6% |
| Immigrants | Eastern Asia | 0.0 /100 | #286 | Tragic 86.5% |
| Immigrants | Malaysia | 0.0 /100 | #287 | Tragic 86.5% |
| Hopi | 0.0 /100 | #288 | Tragic 86.4% |
| Immigrants | Ireland | 0.0 /100 | #289 | Tragic 86.4% |
| Immigrants | Australia | 0.0 /100 | #290 | Tragic 86.4% |
| Pima | 0.0 /100 | #291 | Tragic 86.3% |
| Okinawans | 0.0 /100 | #292 | Tragic 86.1% |