Immigrants from Australia vs Immigrants from India Cognitive Disability
COMPARE
Immigrants from Australia
Immigrants from India
Cognitive Disability
Cognitive Disability Comparison
Immigrants from Australia
Immigrants from India
17.1%
COGNITIVE DISABILITY
76.0/ 100
METRIC RATING
157th/ 347
METRIC RANK
15.9%
COGNITIVE DISABILITY
100.0/ 100
METRIC RATING
2nd/ 347
METRIC RANK
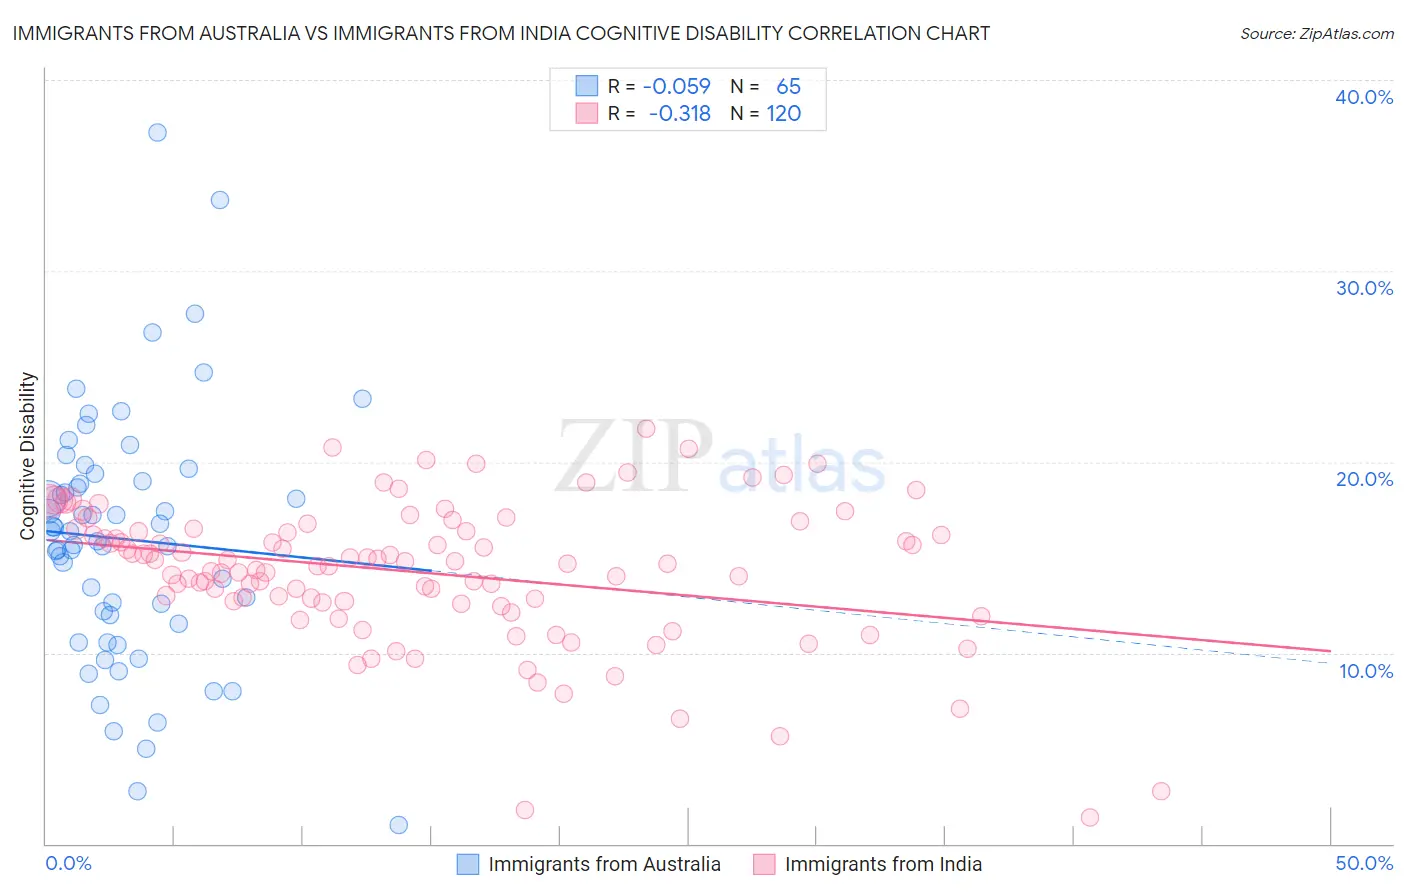
Immigrants from Australia vs Immigrants from India Cognitive Disability Correlation Chart
The statistical analysis conducted on geographies consisting of 227,201,073 people shows a slight negative correlation between the proportion of Immigrants from Australia and percentage of population with cognitive disability in the United States with a correlation coefficient (R) of -0.059 and weighted average of 17.1%. Similarly, the statistical analysis conducted on geographies consisting of 434,093,064 people shows a mild negative correlation between the proportion of Immigrants from India and percentage of population with cognitive disability in the United States with a correlation coefficient (R) of -0.318 and weighted average of 15.9%, a difference of 7.7%.
Cognitive Disability Correlation Summary
| Measurement | Immigrants from Australia | Immigrants from India |
| Minimum | 0.98% | 1.4% |
| Maximum | 37.3% | 21.7% |
| Range | 36.3% | 20.3% |
| Mean | 15.9% | 14.2% |
| Median | 16.4% | 14.6% |
| Interquartile 25% (IQ1) | 11.8% | 12.7% |
| Interquartile 75% (IQ3) | 19.2% | 16.4% |
| Interquartile Range (IQR) | 7.4% | 3.8% |
| Standard Deviation (Sample) | 6.6% | 3.7% |
| Standard Deviation (Population) | 6.5% | 3.7% |
Similar Demographics by Cognitive Disability
Demographics Similar to Immigrants from Australia by Cognitive Disability
In terms of cognitive disability, the demographic groups most similar to Immigrants from Australia are Celtic (17.1%, a difference of 0.070%), Immigrants from Latvia (17.2%, a difference of 0.11%), Brazilian (17.1%, a difference of 0.12%), Sri Lankan (17.1%, a difference of 0.12%), and Immigrants from Malaysia (17.1%, a difference of 0.14%).
| Demographics | Rating | Rank | Cognitive Disability |
| Basques | 85.5 /100 | #150 | Excellent 17.1% |
| Syrians | 83.0 /100 | #151 | Excellent 17.1% |
| Immigrants | Indonesia | 82.7 /100 | #152 | Excellent 17.1% |
| Immigrants | Kazakhstan | 80.5 /100 | #153 | Excellent 17.1% |
| Immigrants | Malaysia | 79.3 /100 | #154 | Good 17.1% |
| Brazilians | 78.9 /100 | #155 | Good 17.1% |
| Sri Lankans | 78.9 /100 | #156 | Good 17.1% |
| Immigrants | Australia | 76.0 /100 | #157 | Good 17.1% |
| Celtics | 74.1 /100 | #158 | Good 17.1% |
| Immigrants | Latvia | 73.2 /100 | #159 | Good 17.2% |
| Australians | 72.4 /100 | #160 | Good 17.2% |
| Americans | 72.2 /100 | #161 | Good 17.2% |
| Yugoslavians | 71.6 /100 | #162 | Good 17.2% |
| Immigrants | Switzerland | 71.5 /100 | #163 | Good 17.2% |
| Armenians | 70.1 /100 | #164 | Good 17.2% |
Demographics Similar to Immigrants from India by Cognitive Disability
In terms of cognitive disability, the demographic groups most similar to Immigrants from India are Chinese (15.9%, a difference of 0.080%), Immigrants from Lithuania (16.0%, a difference of 0.27%), Immigrants from Hong Kong (16.0%, a difference of 0.68%), Immigrants from Taiwan (15.7%, a difference of 1.3%), and Thai (16.1%, a difference of 1.3%).
| Demographics | Rating | Rank | Cognitive Disability |
| Immigrants | Taiwan | 100.0 /100 | #1 | Exceptional 15.7% |
| Immigrants | India | 100.0 /100 | #2 | Exceptional 15.9% |
| Chinese | 100.0 /100 | #3 | Exceptional 15.9% |
| Immigrants | Lithuania | 100.0 /100 | #4 | Exceptional 16.0% |
| Immigrants | Hong Kong | 100.0 /100 | #5 | Exceptional 16.0% |
| Thais | 100.0 /100 | #6 | Exceptional 16.1% |
| Immigrants | Ireland | 100.0 /100 | #7 | Exceptional 16.1% |
| Immigrants | Poland | 100.0 /100 | #8 | Exceptional 16.1% |
| Assyrians/Chaldeans/Syriacs | 100.0 /100 | #9 | Exceptional 16.2% |
| Immigrants | Scotland | 100.0 /100 | #10 | Exceptional 16.2% |
| Immigrants | Czechoslovakia | 100.0 /100 | #11 | Exceptional 16.2% |
| Maltese | 100.0 /100 | #12 | Exceptional 16.2% |
| Lithuanians | 100.0 /100 | #13 | Exceptional 16.3% |
| Immigrants | Austria | 100.0 /100 | #14 | Exceptional 16.3% |
| Immigrants | Greece | 100.0 /100 | #15 | Exceptional 16.3% |