Immigrants from Argentina vs Estonian Male Unemployment
COMPARE
Immigrants from Argentina
Estonian
Male Unemployment
Male Unemployment Comparison
Immigrants from Argentina
Estonians
5.0%
MALE UNEMPLOYMENT
98.1/ 100
METRIC RATING
60th/ 347
METRIC RANK
5.1%
MALE UNEMPLOYMENT
89.0/ 100
METRIC RATING
117th/ 347
METRIC RANK
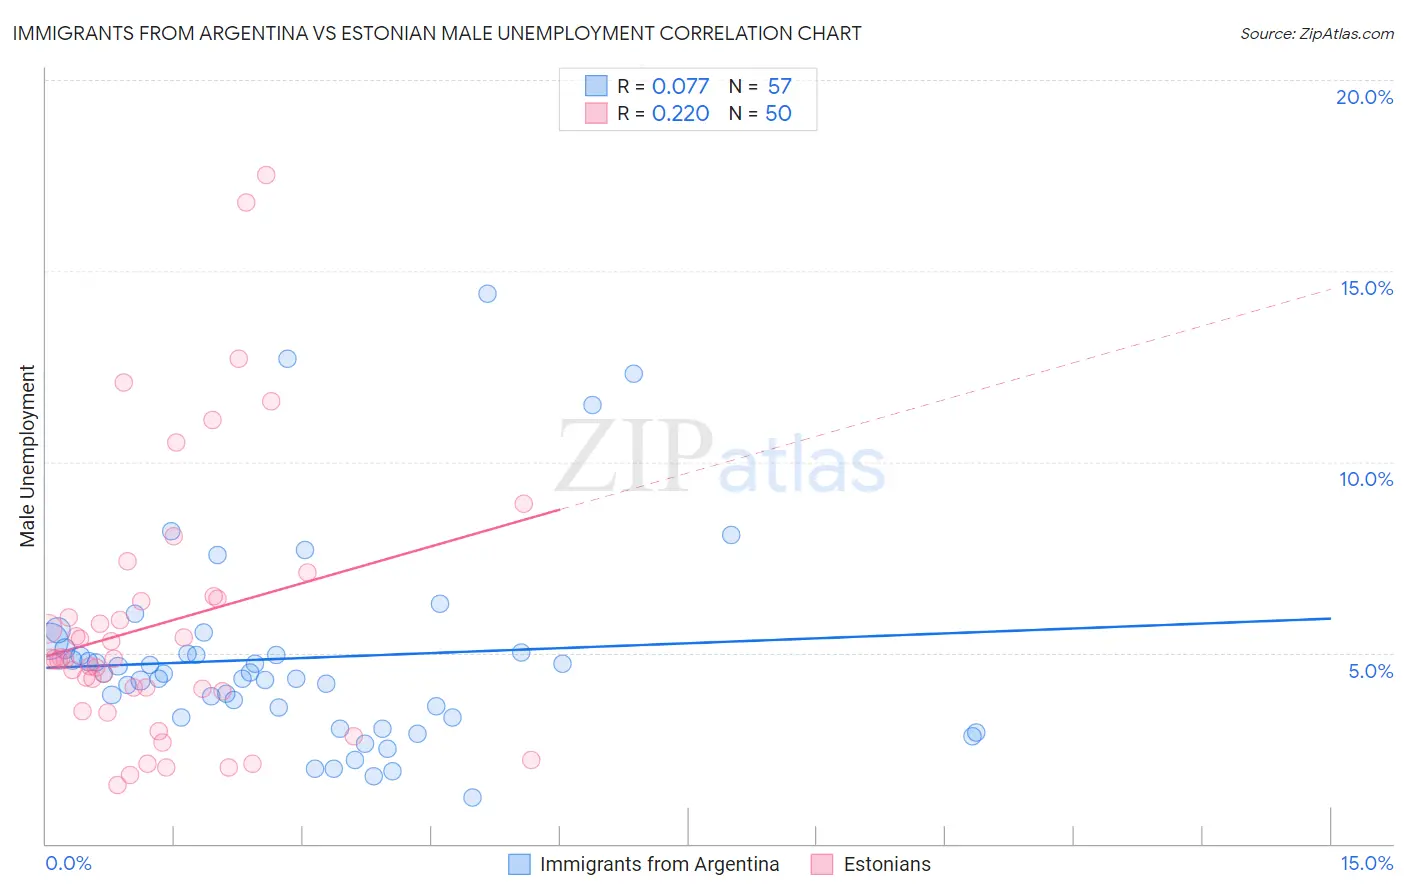
Immigrants from Argentina vs Estonian Male Unemployment Correlation Chart
The statistical analysis conducted on geographies consisting of 264,057,783 people shows a slight positive correlation between the proportion of Immigrants from Argentina and unemployment rate among males in the United States with a correlation coefficient (R) of 0.077 and weighted average of 5.0%. Similarly, the statistical analysis conducted on geographies consisting of 123,372,162 people shows a weak positive correlation between the proportion of Estonians and unemployment rate among males in the United States with a correlation coefficient (R) of 0.220 and weighted average of 5.1%, a difference of 2.9%.
Male Unemployment Correlation Summary
| Measurement | Immigrants from Argentina | Estonian |
| Minimum | 1.2% | 1.5% |
| Maximum | 14.4% | 17.5% |
| Range | 13.2% | 16.0% |
| Mean | 4.9% | 5.8% |
| Median | 4.4% | 4.8% |
| Interquartile 25% (IQ1) | 3.3% | 4.0% |
| Interquartile 75% (IQ3) | 5.1% | 6.4% |
| Interquartile Range (IQR) | 1.8% | 2.4% |
| Standard Deviation (Sample) | 2.7% | 3.6% |
| Standard Deviation (Population) | 2.6% | 3.5% |
Similar Demographics by Male Unemployment
Demographics Similar to Immigrants from Argentina by Male Unemployment
In terms of male unemployment, the demographic groups most similar to Immigrants from Argentina are Cambodian (5.0%, a difference of 0.080%), Immigrants from Netherlands (5.0%, a difference of 0.18%), Basque (5.0%, a difference of 0.20%), Eastern European (5.0%, a difference of 0.22%), and Celtic (5.0%, a difference of 0.24%).
| Demographics | Rating | Rank | Male Unemployment |
| Jordanians | 98.8 /100 | #53 | Exceptional 5.0% |
| Yugoslavians | 98.7 /100 | #54 | Exceptional 5.0% |
| Czechoslovakians | 98.7 /100 | #55 | Exceptional 5.0% |
| Immigrants | Bulgaria | 98.7 /100 | #56 | Exceptional 5.0% |
| Turks | 98.5 /100 | #57 | Exceptional 5.0% |
| Lithuanians | 98.5 /100 | #58 | Exceptional 5.0% |
| Immigrants | Netherlands | 98.3 /100 | #59 | Exceptional 5.0% |
| Immigrants | Argentina | 98.1 /100 | #60 | Exceptional 5.0% |
| Cambodians | 98.1 /100 | #61 | Exceptional 5.0% |
| Basques | 97.9 /100 | #62 | Exceptional 5.0% |
| Eastern Europeans | 97.9 /100 | #63 | Exceptional 5.0% |
| Celtics | 97.8 /100 | #64 | Exceptional 5.0% |
| Icelanders | 97.6 /100 | #65 | Exceptional 5.0% |
| Finns | 97.5 /100 | #66 | Exceptional 5.0% |
| Immigrants | Canada | 97.5 /100 | #67 | Exceptional 5.0% |
Demographics Similar to Estonians by Male Unemployment
In terms of male unemployment, the demographic groups most similar to Estonians are Cypriot (5.1%, a difference of 0.030%), Immigrants from Denmark (5.1%, a difference of 0.050%), French Canadian (5.1%, a difference of 0.070%), Immigrants from Asia (5.1%, a difference of 0.090%), and Ukrainian (5.1%, a difference of 0.090%).
| Demographics | Rating | Rank | Male Unemployment |
| Immigrants | England | 90.8 /100 | #110 | Exceptional 5.1% |
| Immigrants | Eastern Asia | 90.8 /100 | #111 | Exceptional 5.1% |
| Immigrants | Moldova | 90.3 /100 | #112 | Exceptional 5.1% |
| Immigrants | Austria | 90.3 /100 | #113 | Exceptional 5.1% |
| Romanians | 89.8 /100 | #114 | Excellent 5.1% |
| Immigrants | Asia | 89.6 /100 | #115 | Excellent 5.1% |
| Immigrants | Denmark | 89.4 /100 | #116 | Excellent 5.1% |
| Estonians | 89.0 /100 | #117 | Excellent 5.1% |
| Cypriots | 88.8 /100 | #118 | Excellent 5.1% |
| French Canadians | 88.6 /100 | #119 | Excellent 5.1% |
| Ukrainians | 88.4 /100 | #120 | Excellent 5.1% |
| Mongolians | 88.4 /100 | #121 | Excellent 5.1% |
| Nicaraguans | 88.2 /100 | #122 | Excellent 5.1% |
| Palestinians | 87.7 /100 | #123 | Excellent 5.1% |
| Immigrants | Latvia | 87.5 /100 | #124 | Excellent 5.1% |