Immigrants from Argentina vs Estonian Unemployment Among Ages 25 to 29 years
COMPARE
Immigrants from Argentina
Estonian
Unemployment Among Ages 25 to 29 years
Unemployment Among Ages 25 to 29 years Comparison
Immigrants from Argentina
Estonians
6.8%
UNEMPLOYMENT AMONG AGES 25 TO 29 YEARS
21.6/ 100
METRIC RATING
202nd/ 347
METRIC RANK
6.6%
UNEMPLOYMENT AMONG AGES 25 TO 29 YEARS
54.8/ 100
METRIC RATING
168th/ 347
METRIC RANK
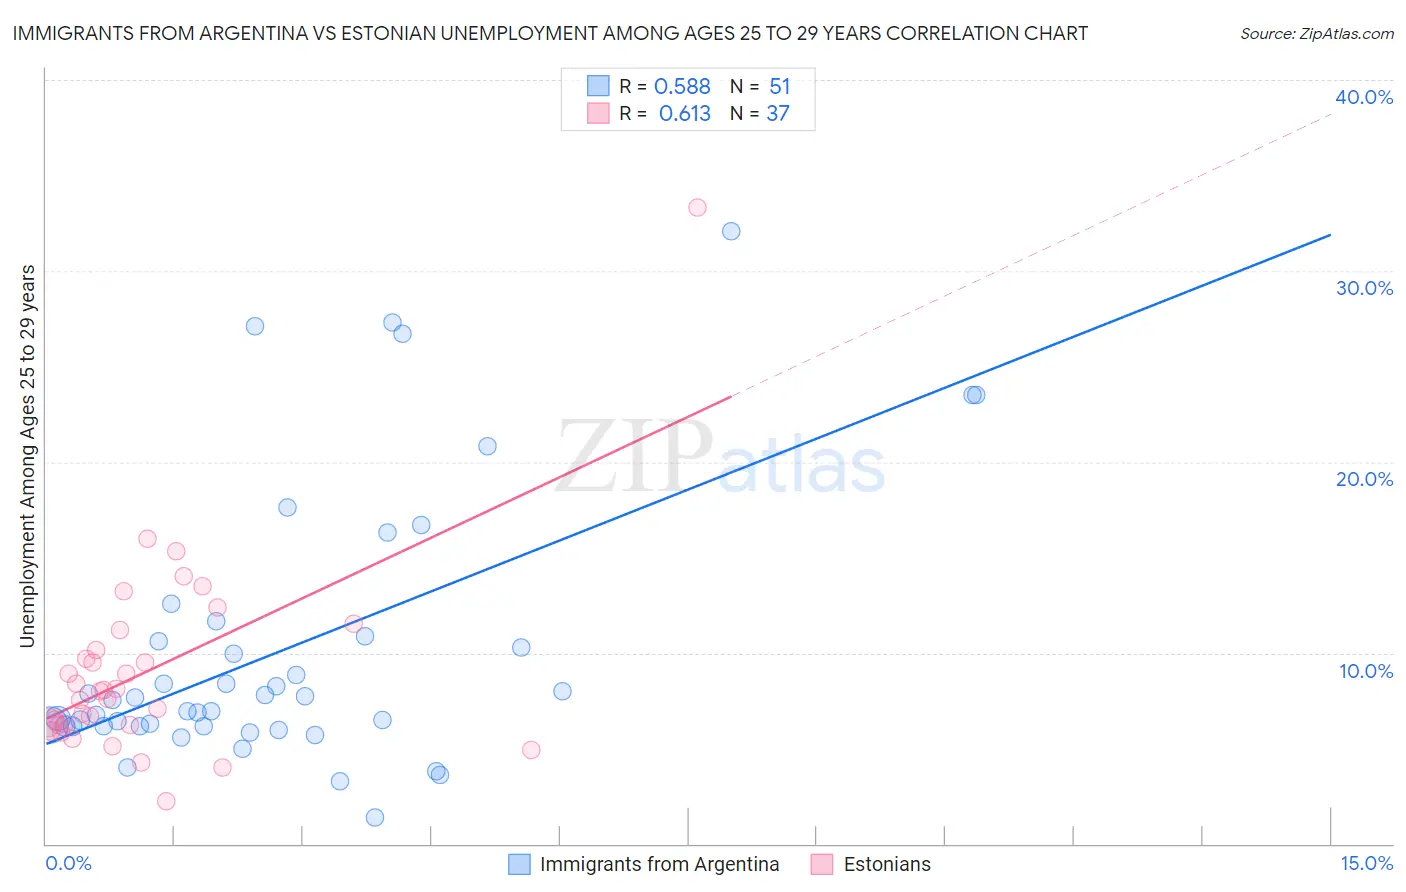
Immigrants from Argentina vs Estonian Unemployment Among Ages 25 to 29 years Correlation Chart
The statistical analysis conducted on geographies consisting of 256,655,444 people shows a substantial positive correlation between the proportion of Immigrants from Argentina and unemployment rate among population between the ages 25 and 29 in the United States with a correlation coefficient (R) of 0.588 and weighted average of 6.8%. Similarly, the statistical analysis conducted on geographies consisting of 120,865,167 people shows a significant positive correlation between the proportion of Estonians and unemployment rate among population between the ages 25 and 29 in the United States with a correlation coefficient (R) of 0.613 and weighted average of 6.6%, a difference of 2.3%.
Unemployment Among Ages 25 to 29 years Correlation Summary
| Measurement | Immigrants from Argentina | Estonian |
| Minimum | 1.4% | 2.2% |
| Maximum | 32.1% | 33.3% |
| Range | 30.7% | 31.1% |
| Mean | 10.2% | 9.0% |
| Median | 7.5% | 8.0% |
| Interquartile 25% (IQ1) | 6.2% | 6.2% |
| Interquartile 75% (IQ3) | 10.8% | 10.7% |
| Interquartile Range (IQR) | 4.7% | 4.5% |
| Standard Deviation (Sample) | 7.1% | 5.2% |
| Standard Deviation (Population) | 7.1% | 5.2% |
Similar Demographics by Unemployment Among Ages 25 to 29 years
Demographics Similar to Immigrants from Argentina by Unemployment Among Ages 25 to 29 years
In terms of unemployment among ages 25 to 29 years, the demographic groups most similar to Immigrants from Argentina are Immigrants from Norway (6.8%, a difference of 0.030%), Basque (6.8%, a difference of 0.080%), South American Indian (6.8%, a difference of 0.15%), Scotch-Irish (6.8%, a difference of 0.15%), and Immigrants from England (6.8%, a difference of 0.16%).
| Demographics | Rating | Rank | Unemployment Among Ages 25 to 29 years |
| Immigrants | Western Asia | 27.3 /100 | #195 | Fair 6.7% |
| Hungarians | 26.8 /100 | #196 | Fair 6.8% |
| Italians | 26.5 /100 | #197 | Fair 6.8% |
| Immigrants | Southern Europe | 24.6 /100 | #198 | Fair 6.8% |
| Guamanians/Chamorros | 24.3 /100 | #199 | Fair 6.8% |
| South American Indians | 23.3 /100 | #200 | Fair 6.8% |
| Basques | 22.5 /100 | #201 | Fair 6.8% |
| Immigrants | Argentina | 21.6 /100 | #202 | Fair 6.8% |
| Immigrants | Norway | 21.2 /100 | #203 | Fair 6.8% |
| Scotch-Irish | 20.0 /100 | #204 | Poor 6.8% |
| Immigrants | England | 19.8 /100 | #205 | Poor 6.8% |
| Ugandans | 19.8 /100 | #206 | Poor 6.8% |
| Immigrants | Denmark | 19.0 /100 | #207 | Poor 6.8% |
| Immigrants | Germany | 18.8 /100 | #208 | Poor 6.8% |
| Hawaiians | 17.1 /100 | #209 | Poor 6.8% |
Demographics Similar to Estonians by Unemployment Among Ages 25 to 29 years
In terms of unemployment among ages 25 to 29 years, the demographic groups most similar to Estonians are Immigrants from Canada (6.6%, a difference of 0.020%), South American (6.6%, a difference of 0.020%), Albanian (6.6%, a difference of 0.080%), Immigrants from Cambodia (6.6%, a difference of 0.14%), and Immigrants from Northern Europe (6.6%, a difference of 0.16%).
| Demographics | Rating | Rank | Unemployment Among Ages 25 to 29 years |
| Paraguayans | 60.4 /100 | #161 | Good 6.6% |
| Immigrants | Czechoslovakia | 60.2 /100 | #162 | Good 6.6% |
| Immigrants | Middle Africa | 59.4 /100 | #163 | Average 6.6% |
| Greeks | 58.5 /100 | #164 | Average 6.6% |
| English | 58.0 /100 | #165 | Average 6.6% |
| Immigrants | Northern Europe | 57.3 /100 | #166 | Average 6.6% |
| Immigrants | Canada | 55.0 /100 | #167 | Average 6.6% |
| Estonians | 54.8 /100 | #168 | Average 6.6% |
| South Americans | 54.5 /100 | #169 | Average 6.6% |
| Albanians | 53.5 /100 | #170 | Average 6.6% |
| Immigrants | Cambodia | 52.6 /100 | #171 | Average 6.6% |
| Bangladeshis | 51.6 /100 | #172 | Average 6.6% |
| Russians | 51.3 /100 | #173 | Average 6.6% |
| Immigrants | North America | 50.0 /100 | #174 | Average 6.6% |
| Immigrants | South Eastern Asia | 49.1 /100 | #175 | Average 6.7% |