Immigrants from Albania vs Cape Verdean Unemployment Among Ages 65 to 74 years
COMPARE
Immigrants from Albania
Cape Verdean
Unemployment Among Ages 65 to 74 years
Unemployment Among Ages 65 to 74 years Comparison
Immigrants from Albania
Cape Verdeans
5.5%
UNEMPLOYMENT AMONG AGES 65 TO 74 YEARS
3.7/ 100
METRIC RATING
227th/ 347
METRIC RANK
5.6%
UNEMPLOYMENT AMONG AGES 65 TO 74 YEARS
0.7/ 100
METRIC RATING
250th/ 347
METRIC RANK
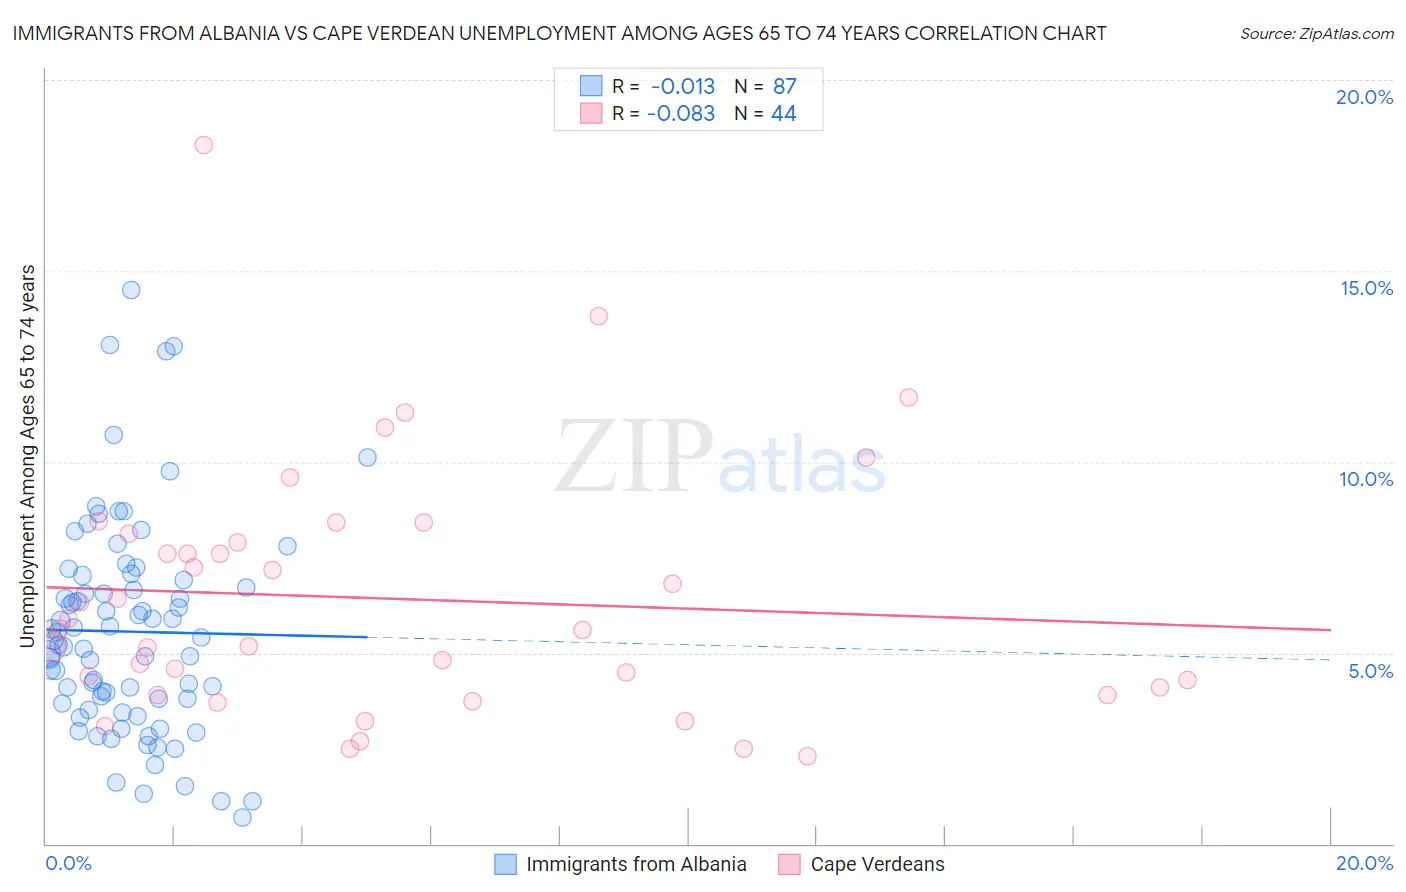
Immigrants from Albania vs Cape Verdean Unemployment Among Ages 65 to 74 years Correlation Chart
The statistical analysis conducted on geographies consisting of 114,150,283 people shows no correlation between the proportion of Immigrants from Albania and unemployment rate among population between the ages 65 and 74 in the United States with a correlation coefficient (R) of -0.013 and weighted average of 5.5%. Similarly, the statistical analysis conducted on geographies consisting of 103,296,098 people shows a slight negative correlation between the proportion of Cape Verdeans and unemployment rate among population between the ages 65 and 74 in the United States with a correlation coefficient (R) of -0.083 and weighted average of 5.6%, a difference of 1.4%.
Unemployment Among Ages 65 to 74 years Correlation Summary
| Measurement | Immigrants from Albania | Cape Verdean |
| Minimum | 0.70% | 2.3% |
| Maximum | 14.5% | 18.3% |
| Range | 13.8% | 16.0% |
| Mean | 5.6% | 6.4% |
| Median | 5.3% | 5.6% |
| Interquartile 25% (IQ1) | 3.7% | 4.0% |
| Interquartile 75% (IQ3) | 6.9% | 8.0% |
| Interquartile Range (IQR) | 3.2% | 4.0% |
| Standard Deviation (Sample) | 2.8% | 3.3% |
| Standard Deviation (Population) | 2.8% | 3.3% |
Similar Demographics by Unemployment Among Ages 65 to 74 years
Demographics Similar to Immigrants from Albania by Unemployment Among Ages 65 to 74 years
In terms of unemployment among ages 65 to 74 years, the demographic groups most similar to Immigrants from Albania are Honduran (5.5%, a difference of 0.0%), Immigrants from Trinidad and Tobago (5.5%, a difference of 0.090%), Immigrants from Uruguay (5.5%, a difference of 0.10%), Hungarian (5.5%, a difference of 0.15%), and Apache (5.5%, a difference of 0.16%).
| Demographics | Rating | Rank | Unemployment Among Ages 65 to 74 years |
| Immigrants | Syria | 5.1 /100 | #220 | Tragic 5.5% |
| Spaniards | 4.8 /100 | #221 | Tragic 5.5% |
| Apache | 4.5 /100 | #222 | Tragic 5.5% |
| Hungarians | 4.4 /100 | #223 | Tragic 5.5% |
| Immigrants | Uruguay | 4.2 /100 | #224 | Tragic 5.5% |
| Immigrants | Trinidad and Tobago | 4.1 /100 | #225 | Tragic 5.5% |
| Hondurans | 3.7 /100 | #226 | Tragic 5.5% |
| Immigrants | Albania | 3.7 /100 | #227 | Tragic 5.5% |
| Immigrants | Israel | 3.0 /100 | #228 | Tragic 5.5% |
| West Indians | 2.7 /100 | #229 | Tragic 5.5% |
| Immigrants | Caribbean | 2.7 /100 | #230 | Tragic 5.5% |
| Israelis | 2.5 /100 | #231 | Tragic 5.5% |
| Nigerians | 2.5 /100 | #232 | Tragic 5.5% |
| South American Indians | 2.3 /100 | #233 | Tragic 5.5% |
| French American Indians | 2.2 /100 | #234 | Tragic 5.5% |
Demographics Similar to Cape Verdeans by Unemployment Among Ages 65 to 74 years
In terms of unemployment among ages 65 to 74 years, the demographic groups most similar to Cape Verdeans are Trinidadian and Tobagonian (5.6%, a difference of 0.080%), Immigrants (5.6%, a difference of 0.14%), Immigrants from Argentina (5.6%, a difference of 0.14%), Paraguayan (5.6%, a difference of 0.19%), and Immigrants from Micronesia (5.6%, a difference of 0.20%).
| Demographics | Rating | Rank | Unemployment Among Ages 65 to 74 years |
| Immigrants | Peru | 1.3 /100 | #243 | Tragic 5.6% |
| Immigrants | Micronesia | 0.9 /100 | #244 | Tragic 5.6% |
| Immigrants | Greece | 0.9 /100 | #245 | Tragic 5.6% |
| Paraguayans | 0.9 /100 | #246 | Tragic 5.6% |
| Immigrants | Immigrants | 0.9 /100 | #247 | Tragic 5.6% |
| Immigrants | Argentina | 0.9 /100 | #248 | Tragic 5.6% |
| Trinidadians and Tobagonians | 0.8 /100 | #249 | Tragic 5.6% |
| Cape Verdeans | 0.7 /100 | #250 | Tragic 5.6% |
| Brazilians | 0.5 /100 | #251 | Tragic 5.6% |
| Colombians | 0.5 /100 | #252 | Tragic 5.6% |
| Immigrants | Brazil | 0.5 /100 | #253 | Tragic 5.6% |
| Immigrants | Costa Rica | 0.5 /100 | #254 | Tragic 5.6% |
| Immigrants | Haiti | 0.4 /100 | #255 | Tragic 5.6% |
| Native Hawaiians | 0.4 /100 | #256 | Tragic 5.6% |
| Immigrants | Southern Europe | 0.3 /100 | #257 | Tragic 5.6% |