Immigrants from Albania vs Cape Verdean Householder Income Ages 25 - 44 years
COMPARE
Immigrants from Albania
Cape Verdean
Householder Income Ages 25 - 44 years
Householder Income Ages 25 - 44 years Comparison
Immigrants from Albania
Cape Verdeans
$97,929
HOUSEHOLDER INCOME AGES 25 - 44 YEARS
86.6/ 100
METRIC RATING
131st/ 347
METRIC RANK
$85,758
HOUSEHOLDER INCOME AGES 25 - 44 YEARS
0.8/ 100
METRIC RATING
251st/ 347
METRIC RANK
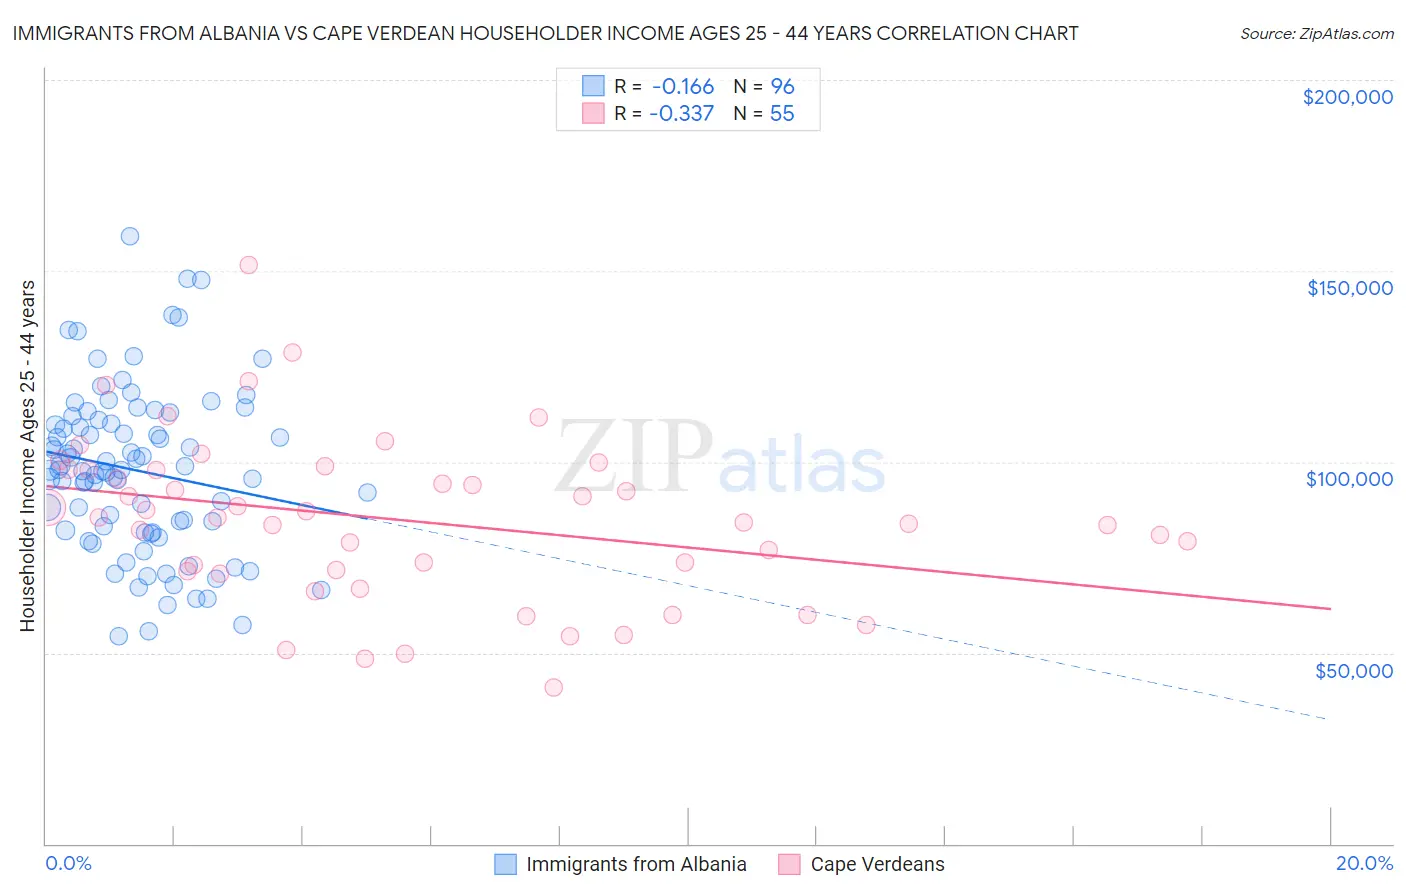
Immigrants from Albania vs Cape Verdean Householder Income Ages 25 - 44 years Correlation Chart
The statistical analysis conducted on geographies consisting of 119,323,359 people shows a poor negative correlation between the proportion of Immigrants from Albania and household income with householder between the ages 25 and 44 in the United States with a correlation coefficient (R) of -0.166 and weighted average of $97,929. Similarly, the statistical analysis conducted on geographies consisting of 107,474,022 people shows a mild negative correlation between the proportion of Cape Verdeans and household income with householder between the ages 25 and 44 in the United States with a correlation coefficient (R) of -0.337 and weighted average of $85,758, a difference of 14.2%.
Householder Income Ages 25 - 44 years Correlation Summary
| Measurement | Immigrants from Albania | Cape Verdean |
| Minimum | $54,306 | $41,033 |
| Maximum | $159,200 | $151,693 |
| Range | $104,894 | $110,660 |
| Mean | $97,705 | $84,702 |
| Median | $97,845 | $85,334 |
| Interquartile 25% (IQ1) | $81,795 | $71,313 |
| Interquartile 75% (IQ3) | $110,452 | $97,942 |
| Interquartile Range (IQR) | $28,657 | $26,629 |
| Standard Deviation (Sample) | $21,537 | $21,551 |
| Standard Deviation (Population) | $21,424 | $21,354 |
Similar Demographics by Householder Income Ages 25 - 44 years
Demographics Similar to Immigrants from Albania by Householder Income Ages 25 - 44 years
In terms of householder income ages 25 - 44 years, the demographic groups most similar to Immigrants from Albania are Immigrants from Zimbabwe ($97,880, a difference of 0.050%), Tsimshian ($97,809, a difference of 0.12%), Immigrants from Kuwait ($98,122, a difference of 0.20%), Canadian ($97,625, a difference of 0.31%), and Immigrants from Oceania ($97,623, a difference of 0.31%).
| Demographics | Rating | Rank | Householder Income Ages 25 - 44 years |
| Zimbabweans | 90.3 /100 | #124 | Exceptional $98,586 |
| Pakistanis | 89.3 /100 | #125 | Excellent $98,401 |
| British | 89.1 /100 | #126 | Excellent $98,359 |
| Serbians | 88.9 /100 | #127 | Excellent $98,320 |
| Europeans | 88.9 /100 | #128 | Excellent $98,310 |
| Brazilians | 88.6 /100 | #129 | Excellent $98,267 |
| Immigrants | Kuwait | 87.8 /100 | #130 | Excellent $98,122 |
| Immigrants | Albania | 86.6 /100 | #131 | Excellent $97,929 |
| Immigrants | Zimbabwe | 86.3 /100 | #132 | Excellent $97,880 |
| Tsimshian | 85.8 /100 | #133 | Excellent $97,809 |
| Canadians | 84.5 /100 | #134 | Excellent $97,625 |
| Immigrants | Oceania | 84.5 /100 | #135 | Excellent $97,623 |
| Hungarians | 83.9 /100 | #136 | Excellent $97,544 |
| Lebanese | 82.3 /100 | #137 | Excellent $97,339 |
| Arabs | 82.3 /100 | #138 | Excellent $97,336 |
Demographics Similar to Cape Verdeans by Householder Income Ages 25 - 44 years
In terms of householder income ages 25 - 44 years, the demographic groups most similar to Cape Verdeans are Pennsylvania German ($85,836, a difference of 0.090%), Immigrants from Western Africa ($85,676, a difference of 0.10%), French American Indian ($85,899, a difference of 0.16%), British West Indian ($85,565, a difference of 0.23%), and Immigrants from Laos ($85,553, a difference of 0.24%).
| Demographics | Rating | Rank | Householder Income Ages 25 - 44 years |
| Immigrants | Venezuela | 1.5 /100 | #244 | Tragic $87,038 |
| Immigrants | El Salvador | 1.4 /100 | #245 | Tragic $86,913 |
| Immigrants | Burma/Myanmar | 1.3 /100 | #246 | Tragic $86,736 |
| Immigrants | Nigeria | 1.2 /100 | #247 | Tragic $86,589 |
| Immigrants | Sudan | 0.9 /100 | #248 | Tragic $86,109 |
| French American Indians | 0.8 /100 | #249 | Tragic $85,899 |
| Pennsylvania Germans | 0.8 /100 | #250 | Tragic $85,836 |
| Cape Verdeans | 0.8 /100 | #251 | Tragic $85,758 |
| Immigrants | Western Africa | 0.7 /100 | #252 | Tragic $85,676 |
| British West Indians | 0.7 /100 | #253 | Tragic $85,565 |
| Immigrants | Laos | 0.7 /100 | #254 | Tragic $85,553 |
| German Russians | 0.6 /100 | #255 | Tragic $85,220 |
| Central Americans | 0.5 /100 | #256 | Tragic $85,144 |
| Mexican American Indians | 0.5 /100 | #257 | Tragic $85,066 |
| Immigrants | Nicaragua | 0.5 /100 | #258 | Tragic $84,914 |