Immigrants from Africa vs Finnish Single Mother Households
COMPARE
Immigrants from Africa
Finnish
Single Mother Households
Single Mother Households Comparison
Immigrants from Africa
Finns
7.3%
SINGLE MOTHER HOUSEHOLDS
0.4/ 100
METRIC RATING
250th/ 347
METRIC RANK
5.7%
SINGLE MOTHER HOUSEHOLDS
97.6/ 100
METRIC RATING
86th/ 347
METRIC RANK
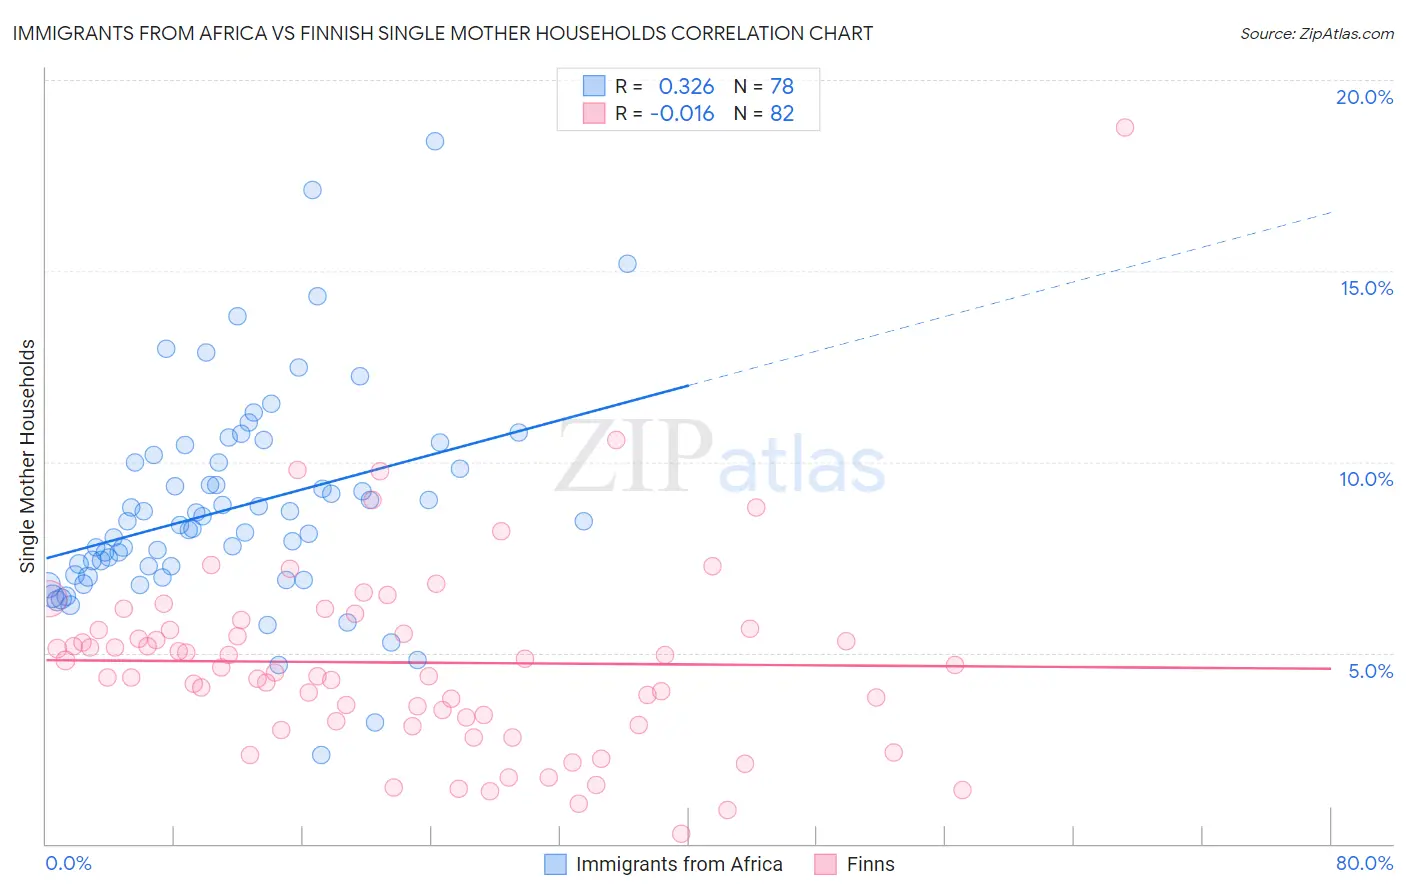
Immigrants from Africa vs Finnish Single Mother Households Correlation Chart
The statistical analysis conducted on geographies consisting of 467,655,792 people shows a mild positive correlation between the proportion of Immigrants from Africa and percentage of single mother households in the United States with a correlation coefficient (R) of 0.326 and weighted average of 7.3%. Similarly, the statistical analysis conducted on geographies consisting of 403,107,301 people shows no correlation between the proportion of Finns and percentage of single mother households in the United States with a correlation coefficient (R) of -0.016 and weighted average of 5.7%, a difference of 28.3%.
Single Mother Households Correlation Summary
| Measurement | Immigrants from Africa | Finnish |
| Minimum | 2.3% | 0.26% |
| Maximum | 18.4% | 18.8% |
| Range | 16.1% | 18.5% |
| Mean | 8.8% | 4.7% |
| Median | 8.4% | 4.5% |
| Interquartile 25% (IQ1) | 7.0% | 3.2% |
| Interquartile 75% (IQ3) | 10.0% | 5.6% |
| Interquartile Range (IQR) | 3.0% | 2.4% |
| Standard Deviation (Sample) | 2.7% | 2.6% |
| Standard Deviation (Population) | 2.7% | 2.6% |
Similar Demographics by Single Mother Households
Demographics Similar to Immigrants from Africa by Single Mother Households
In terms of single mother households, the demographic groups most similar to Immigrants from Africa are Bermudan (7.3%, a difference of 0.010%), Spanish American Indian (7.3%, a difference of 0.30%), Dutch West Indian (7.3%, a difference of 0.33%), Malaysian (7.3%, a difference of 0.34%), and Alaskan Athabascan (7.3%, a difference of 0.37%).
| Demographics | Rating | Rank | Single Mother Households |
| Ecuadorians | 0.6 /100 | #243 | Tragic 7.2% |
| Cubans | 0.6 /100 | #244 | Tragic 7.2% |
| Immigrants | Cambodia | 0.5 /100 | #245 | Tragic 7.2% |
| Nicaraguans | 0.5 /100 | #246 | Tragic 7.2% |
| Dutch West Indians | 0.4 /100 | #247 | Tragic 7.3% |
| Spanish American Indians | 0.4 /100 | #248 | Tragic 7.3% |
| Bermudans | 0.4 /100 | #249 | Tragic 7.3% |
| Immigrants | Africa | 0.4 /100 | #250 | Tragic 7.3% |
| Malaysians | 0.3 /100 | #251 | Tragic 7.3% |
| Alaskan Athabascans | 0.3 /100 | #252 | Tragic 7.3% |
| Cajuns | 0.3 /100 | #253 | Tragic 7.3% |
| Immigrants | Ecuador | 0.3 /100 | #254 | Tragic 7.3% |
| Mexican American Indians | 0.2 /100 | #255 | Tragic 7.4% |
| Seminole | 0.2 /100 | #256 | Tragic 7.4% |
| Alaska Natives | 0.2 /100 | #257 | Tragic 7.4% |
Demographics Similar to Finns by Single Mother Households
In terms of single mother households, the demographic groups most similar to Finns are Hungarian (5.7%, a difference of 0.030%), Immigrants from Turkey (5.7%, a difference of 0.080%), Israeli (5.7%, a difference of 0.15%), Carpatho Rusyn (5.7%, a difference of 0.18%), and Immigrants from Hungary (5.7%, a difference of 0.25%).
| Demographics | Rating | Rank | Single Mother Households |
| Immigrants | Sri Lanka | 98.0 /100 | #79 | Exceptional 5.6% |
| Czechs | 97.9 /100 | #80 | Exceptional 5.6% |
| Immigrants | Moldova | 97.9 /100 | #81 | Exceptional 5.6% |
| Immigrants | Malaysia | 97.8 /100 | #82 | Exceptional 5.7% |
| Immigrants | Hungary | 97.8 /100 | #83 | Exceptional 5.7% |
| Carpatho Rusyns | 97.7 /100 | #84 | Exceptional 5.7% |
| Hungarians | 97.6 /100 | #85 | Exceptional 5.7% |
| Finns | 97.6 /100 | #86 | Exceptional 5.7% |
| Immigrants | Turkey | 97.5 /100 | #87 | Exceptional 5.7% |
| Israelis | 97.4 /100 | #88 | Exceptional 5.7% |
| Ukrainians | 97.2 /100 | #89 | Exceptional 5.7% |
| Immigrants | Indonesia | 97.2 /100 | #90 | Exceptional 5.7% |
| Europeans | 97.0 /100 | #91 | Exceptional 5.7% |
| Immigrants | Western Asia | 96.7 /100 | #92 | Exceptional 5.7% |
| Serbians | 96.7 /100 | #93 | Exceptional 5.7% |