Immigrants from Afghanistan vs White/Caucasian Bachelor's Degree
COMPARE
Immigrants from Afghanistan
White/Caucasian
Bachelor's Degree
Bachelor's Degree Comparison
Immigrants from Afghanistan
Whites/Caucasians
39.1%
BACHELOR'S DEGREE
79.7/ 100
METRIC RATING
144th/ 347
METRIC RANK
35.3%
BACHELOR'S DEGREE
5.9/ 100
METRIC RATING
229th/ 347
METRIC RANK
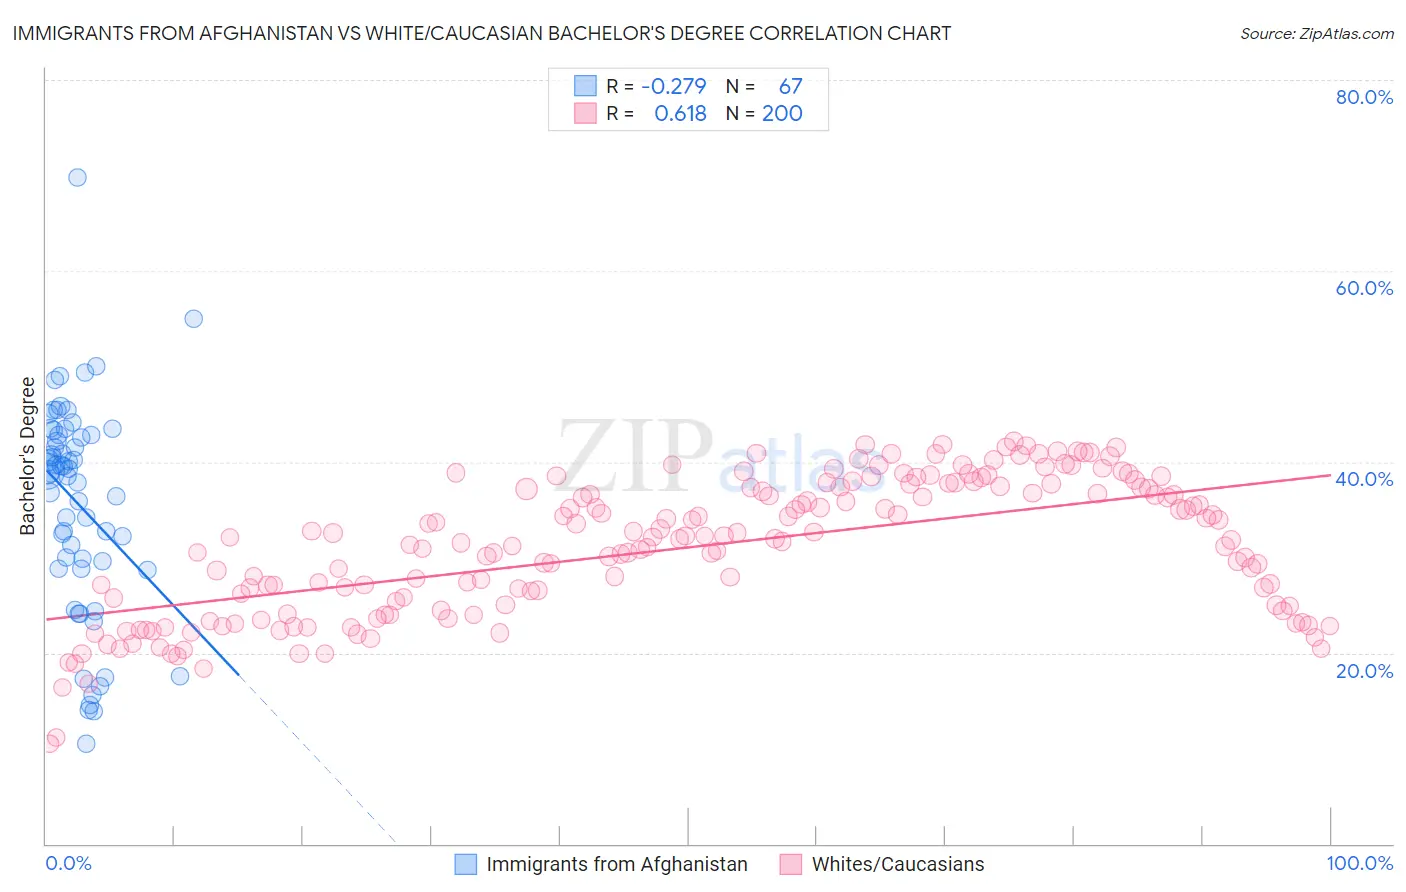
Immigrants from Afghanistan vs White/Caucasian Bachelor's Degree Correlation Chart
The statistical analysis conducted on geographies consisting of 147,641,942 people shows a weak negative correlation between the proportion of Immigrants from Afghanistan and percentage of population with at least bachelor's degree education in the United States with a correlation coefficient (R) of -0.279 and weighted average of 39.1%. Similarly, the statistical analysis conducted on geographies consisting of 584,716,229 people shows a significant positive correlation between the proportion of Whites/Caucasians and percentage of population with at least bachelor's degree education in the United States with a correlation coefficient (R) of 0.618 and weighted average of 35.3%, a difference of 10.8%.
Bachelor's Degree Correlation Summary
| Measurement | Immigrants from Afghanistan | White/Caucasian |
| Minimum | 10.5% | 10.4% |
| Maximum | 69.8% | 42.1% |
| Range | 59.3% | 31.7% |
| Mean | 35.6% | 31.0% |
| Median | 38.9% | 31.9% |
| Interquartile 25% (IQ1) | 28.9% | 24.9% |
| Interquartile 75% (IQ3) | 42.9% | 37.3% |
| Interquartile Range (IQR) | 14.0% | 12.4% |
| Standard Deviation (Sample) | 11.2% | 7.1% |
| Standard Deviation (Population) | 11.2% | 7.1% |
Similar Demographics by Bachelor's Degree
Demographics Similar to Immigrants from Afghanistan by Bachelor's Degree
In terms of bachelor's degree, the demographic groups most similar to Immigrants from Afghanistan are Polish (39.1%, a difference of 0.020%), Slovene (39.1%, a difference of 0.030%), Swedish (39.1%, a difference of 0.070%), Immigrants from Sierra Leone (39.0%, a difference of 0.10%), and Iraqi (39.0%, a difference of 0.24%).
| Demographics | Rating | Rank | Bachelor's Degree |
| Icelanders | 86.5 /100 | #137 | Excellent 39.5% |
| Europeans | 85.6 /100 | #138 | Excellent 39.5% |
| Immigrants | Sudan | 84.5 /100 | #139 | Excellent 39.4% |
| Immigrants | Armenia | 84.1 /100 | #140 | Excellent 39.4% |
| South American Indians | 83.6 /100 | #141 | Excellent 39.3% |
| Immigrants | North Macedonia | 81.6 /100 | #142 | Excellent 39.2% |
| Poles | 79.8 /100 | #143 | Good 39.1% |
| Immigrants | Afghanistan | 79.7 /100 | #144 | Good 39.1% |
| Slovenes | 79.5 /100 | #145 | Good 39.1% |
| Swedes | 79.2 /100 | #146 | Good 39.1% |
| Immigrants | Sierra Leone | 79.0 /100 | #147 | Good 39.0% |
| Iraqis | 78.1 /100 | #148 | Good 39.0% |
| Immigrants | Poland | 77.5 /100 | #149 | Good 39.0% |
| South Americans | 77.3 /100 | #150 | Good 38.9% |
| Immigrants | Africa | 76.5 /100 | #151 | Good 38.9% |
Demographics Similar to Whites/Caucasians by Bachelor's Degree
In terms of bachelor's degree, the demographic groups most similar to Whites/Caucasians are Immigrants from Trinidad and Tobago (35.3%, a difference of 0.080%), Ecuadorian (35.4%, a difference of 0.31%), Portuguese (35.5%, a difference of 0.57%), Immigrants from Burma/Myanmar (35.5%, a difference of 0.61%), and Immigrants from Barbados (35.5%, a difference of 0.68%).
| Demographics | Rating | Rank | Bachelor's Degree |
| Trinidadians and Tobagonians | 8.8 /100 | #222 | Tragic 35.7% |
| French Canadians | 8.3 /100 | #223 | Tragic 35.6% |
| Immigrants | Barbados | 7.5 /100 | #224 | Tragic 35.5% |
| Immigrants | Burma/Myanmar | 7.3 /100 | #225 | Tragic 35.5% |
| Portuguese | 7.2 /100 | #226 | Tragic 35.5% |
| Ecuadorians | 6.6 /100 | #227 | Tragic 35.4% |
| Immigrants | Trinidad and Tobago | 6.0 /100 | #228 | Tragic 35.3% |
| Whites/Caucasians | 5.9 /100 | #229 | Tragic 35.3% |
| Immigrants | Grenada | 4.3 /100 | #230 | Tragic 35.0% |
| Immigrants | St. Vincent and the Grenadines | 4.3 /100 | #231 | Tragic 35.0% |
| Hmong | 3.4 /100 | #232 | Tragic 34.8% |
| Immigrants | Ecuador | 3.3 /100 | #233 | Tragic 34.7% |
| Guamanians/Chamorros | 3.0 /100 | #234 | Tragic 34.6% |
| Immigrants | West Indies | 2.9 /100 | #235 | Tragic 34.6% |
| Liberians | 2.8 /100 | #236 | Tragic 34.6% |