Immigrants from Afghanistan vs Immigrants from Lebanon 2 or more Vehicles in Household
COMPARE
Immigrants from Afghanistan
Immigrants from Lebanon
2 or more Vehicles in Household
2 or more Vehicles in Household Comparison
Immigrants from Afghanistan
Immigrants from Lebanon
58.3%
2 OR MORE VEHICLES IN HOUSEHOLD
99.6/ 100
METRIC RATING
74th/ 347
METRIC RANK
57.2%
2 OR MORE VEHICLES IN HOUSEHOLD
96.8/ 100
METRIC RATING
114th/ 347
METRIC RANK
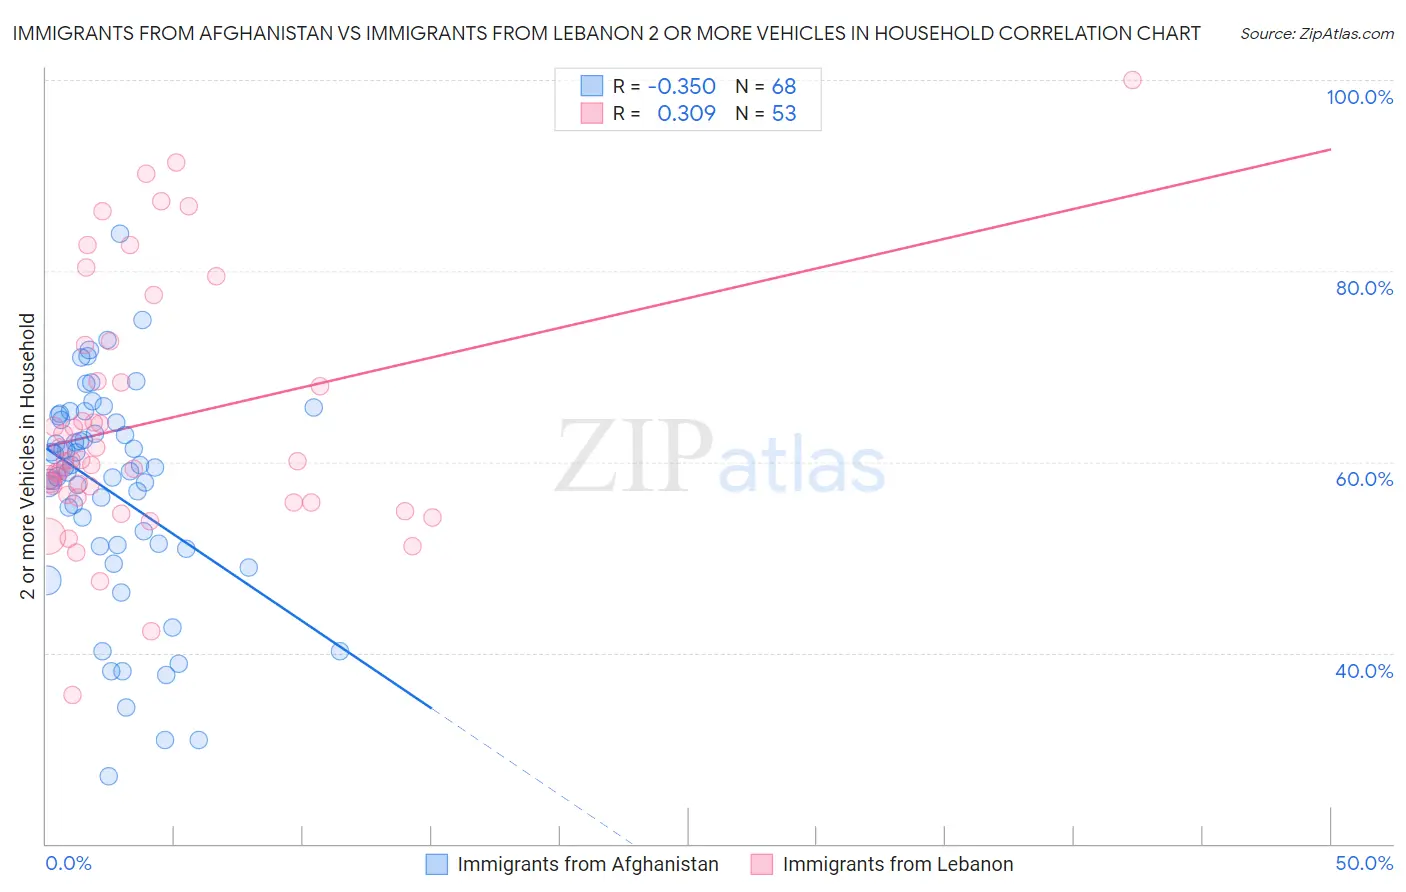
Immigrants from Afghanistan vs Immigrants from Lebanon 2 or more Vehicles in Household Correlation Chart
The statistical analysis conducted on geographies consisting of 147,637,495 people shows a mild negative correlation between the proportion of Immigrants from Afghanistan and percentage of households with 2 or more vehicles available in the United States with a correlation coefficient (R) of -0.350 and weighted average of 58.3%. Similarly, the statistical analysis conducted on geographies consisting of 217,126,913 people shows a mild positive correlation between the proportion of Immigrants from Lebanon and percentage of households with 2 or more vehicles available in the United States with a correlation coefficient (R) of 0.309 and weighted average of 57.2%, a difference of 1.9%.
2 or more Vehicles in Household Correlation Summary
| Measurement | Immigrants from Afghanistan | Immigrants from Lebanon |
| Minimum | 27.1% | 35.5% |
| Maximum | 83.9% | 100.0% |
| Range | 56.8% | 64.5% |
| Mean | 56.9% | 64.1% |
| Median | 59.2% | 60.1% |
| Interquartile 25% (IQ1) | 51.2% | 56.0% |
| Interquartile 75% (IQ3) | 64.3% | 70.4% |
| Interquartile Range (IQR) | 13.0% | 14.3% |
| Standard Deviation (Sample) | 11.4% | 13.2% |
| Standard Deviation (Population) | 11.3% | 13.1% |
Similar Demographics by 2 or more Vehicles in Household
Demographics Similar to Immigrants from Afghanistan by 2 or more Vehicles in Household
In terms of 2 or more vehicles in household, the demographic groups most similar to Immigrants from Afghanistan are Bolivian (58.3%, a difference of 0.0%), Polish (58.3%, a difference of 0.080%), Creek (58.3%, a difference of 0.11%), Slovene (58.3%, a difference of 0.12%), and Austrian (58.4%, a difference of 0.13%).
| Demographics | Rating | Rank | 2 or more Vehicles in Household |
| Laotians | 99.7 /100 | #67 | Exceptional 58.6% |
| Canadians | 99.7 /100 | #68 | Exceptional 58.6% |
| Pennsylvania Germans | 99.7 /100 | #69 | Exceptional 58.5% |
| Italians | 99.6 /100 | #70 | Exceptional 58.4% |
| Bangladeshis | 99.6 /100 | #71 | Exceptional 58.4% |
| Austrians | 99.6 /100 | #72 | Exceptional 58.4% |
| Bolivians | 99.6 /100 | #73 | Exceptional 58.3% |
| Immigrants | Afghanistan | 99.6 /100 | #74 | Exceptional 58.3% |
| Poles | 99.5 /100 | #75 | Exceptional 58.3% |
| Creek | 99.5 /100 | #76 | Exceptional 58.3% |
| Slovenes | 99.5 /100 | #77 | Exceptional 58.3% |
| Lithuanians | 99.5 /100 | #78 | Exceptional 58.2% |
| Delaware | 99.4 /100 | #79 | Exceptional 58.2% |
| Immigrants | England | 99.3 /100 | #80 | Exceptional 58.1% |
| Immigrants | Iraq | 99.3 /100 | #81 | Exceptional 58.1% |
Demographics Similar to Immigrants from Lebanon by 2 or more Vehicles in Household
In terms of 2 or more vehicles in household, the demographic groups most similar to Immigrants from Lebanon are Zimbabwean (57.2%, a difference of 0.030%), Chippewa (57.2%, a difference of 0.050%), Immigrants from Jordan (57.2%, a difference of 0.070%), Iraqi (57.1%, a difference of 0.26%), and Asian (57.0%, a difference of 0.42%).
| Demographics | Rating | Rank | 2 or more Vehicles in Household |
| Immigrants | Netherlands | 98.2 /100 | #107 | Exceptional 57.5% |
| Immigrants | Canada | 98.1 /100 | #108 | Exceptional 57.5% |
| Immigrants | North America | 98.1 /100 | #109 | Exceptional 57.5% |
| Japanese | 98.0 /100 | #110 | Exceptional 57.5% |
| Greeks | 98.0 /100 | #111 | Exceptional 57.5% |
| Pueblo | 98.0 /100 | #112 | Exceptional 57.5% |
| Zimbabweans | 96.9 /100 | #113 | Exceptional 57.2% |
| Immigrants | Lebanon | 96.8 /100 | #114 | Exceptional 57.2% |
| Chippewa | 96.6 /100 | #115 | Exceptional 57.2% |
| Immigrants | Jordan | 96.6 /100 | #116 | Exceptional 57.2% |
| Iraqis | 95.8 /100 | #117 | Exceptional 57.1% |
| Asians | 95.1 /100 | #118 | Exceptional 57.0% |
| Natives/Alaskans | 95.0 /100 | #119 | Exceptional 57.0% |
| Costa Ricans | 94.7 /100 | #120 | Exceptional 56.9% |
| Sioux | 93.8 /100 | #121 | Exceptional 56.8% |