Immigrants from Afghanistan vs Yuman 2 or more Vehicles in Household
COMPARE
Immigrants from Afghanistan
Yuman
2 or more Vehicles in Household
2 or more Vehicles in Household Comparison
Immigrants from Afghanistan
Yuman
58.3%
2 OR MORE VEHICLES IN HOUSEHOLD
99.6/ 100
METRIC RATING
74th/ 347
METRIC RANK
51.7%
2 OR MORE VEHICLES IN HOUSEHOLD
0.1/ 100
METRIC RATING
278th/ 347
METRIC RANK
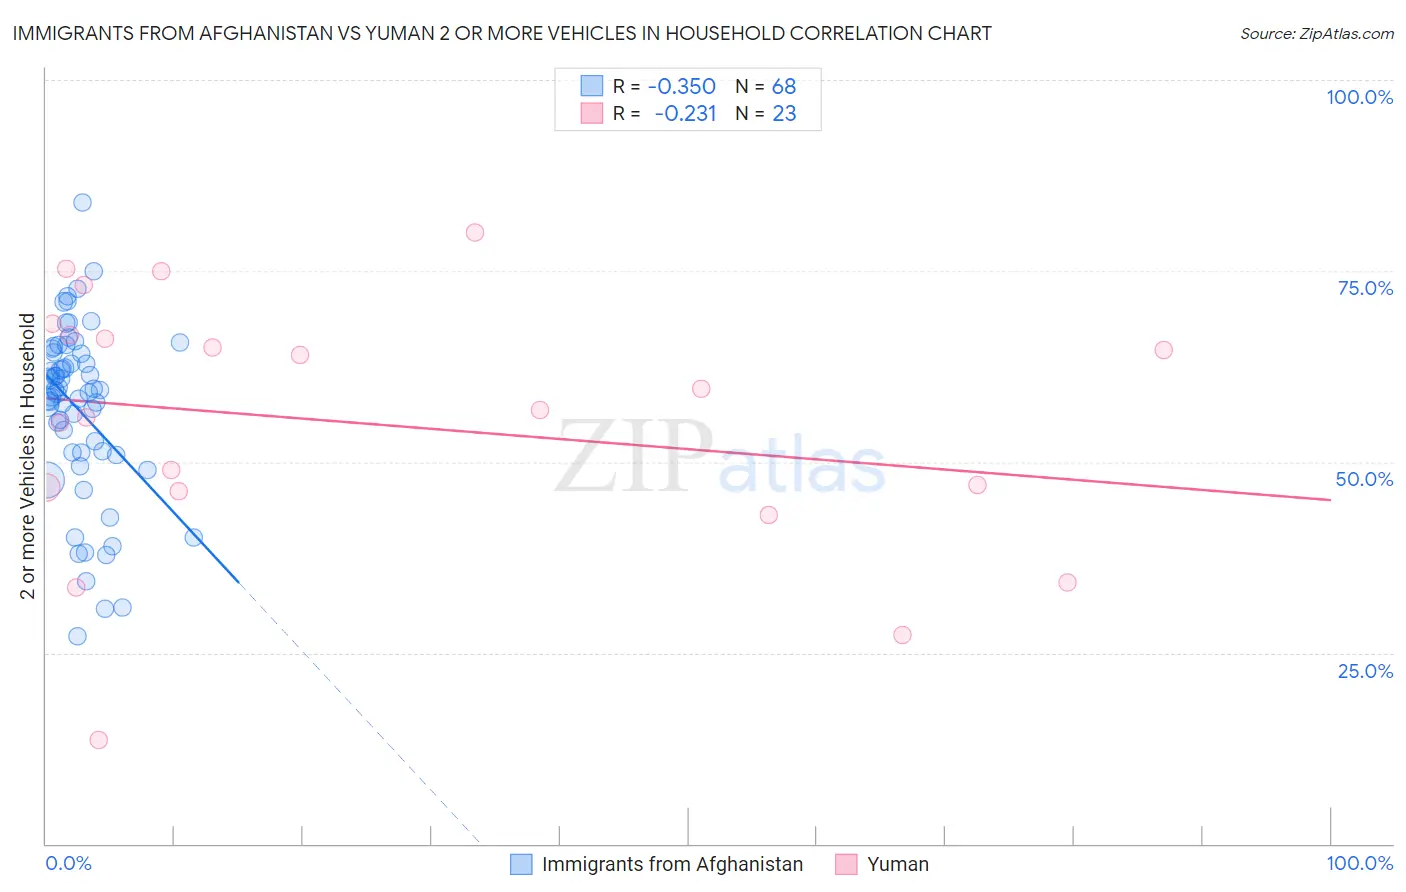
Immigrants from Afghanistan vs Yuman 2 or more Vehicles in Household Correlation Chart
The statistical analysis conducted on geographies consisting of 147,637,495 people shows a mild negative correlation between the proportion of Immigrants from Afghanistan and percentage of households with 2 or more vehicles available in the United States with a correlation coefficient (R) of -0.350 and weighted average of 58.3%. Similarly, the statistical analysis conducted on geographies consisting of 40,663,643 people shows a weak negative correlation between the proportion of Yuman and percentage of households with 2 or more vehicles available in the United States with a correlation coefficient (R) of -0.231 and weighted average of 51.7%, a difference of 12.7%.
2 or more Vehicles in Household Correlation Summary
| Measurement | Immigrants from Afghanistan | Yuman |
| Minimum | 27.1% | 13.6% |
| Maximum | 83.9% | 80.0% |
| Range | 56.8% | 66.4% |
| Mean | 56.9% | 55.0% |
| Median | 59.2% | 56.8% |
| Interquartile 25% (IQ1) | 51.2% | 46.1% |
| Interquartile 75% (IQ3) | 64.3% | 66.6% |
| Interquartile Range (IQR) | 13.0% | 20.5% |
| Standard Deviation (Sample) | 11.4% | 16.9% |
| Standard Deviation (Population) | 11.3% | 16.5% |
Similar Demographics by 2 or more Vehicles in Household
Demographics Similar to Immigrants from Afghanistan by 2 or more Vehicles in Household
In terms of 2 or more vehicles in household, the demographic groups most similar to Immigrants from Afghanistan are Bolivian (58.3%, a difference of 0.0%), Polish (58.3%, a difference of 0.080%), Creek (58.3%, a difference of 0.11%), Slovene (58.3%, a difference of 0.12%), and Austrian (58.4%, a difference of 0.13%).
| Demographics | Rating | Rank | 2 or more Vehicles in Household |
| Laotians | 99.7 /100 | #67 | Exceptional 58.6% |
| Canadians | 99.7 /100 | #68 | Exceptional 58.6% |
| Pennsylvania Germans | 99.7 /100 | #69 | Exceptional 58.5% |
| Italians | 99.6 /100 | #70 | Exceptional 58.4% |
| Bangladeshis | 99.6 /100 | #71 | Exceptional 58.4% |
| Austrians | 99.6 /100 | #72 | Exceptional 58.4% |
| Bolivians | 99.6 /100 | #73 | Exceptional 58.3% |
| Immigrants | Afghanistan | 99.6 /100 | #74 | Exceptional 58.3% |
| Poles | 99.5 /100 | #75 | Exceptional 58.3% |
| Creek | 99.5 /100 | #76 | Exceptional 58.3% |
| Slovenes | 99.5 /100 | #77 | Exceptional 58.3% |
| Lithuanians | 99.5 /100 | #78 | Exceptional 58.2% |
| Delaware | 99.4 /100 | #79 | Exceptional 58.2% |
| Immigrants | England | 99.3 /100 | #80 | Exceptional 58.1% |
| Immigrants | Iraq | 99.3 /100 | #81 | Exceptional 58.1% |
Demographics Similar to Yuman by 2 or more Vehicles in Household
In terms of 2 or more vehicles in household, the demographic groups most similar to Yuman are Liberian (51.7%, a difference of 0.010%), Immigrants from Eastern Europe (51.7%, a difference of 0.040%), Immigrants from Africa (51.8%, a difference of 0.060%), Immigrants from Croatia (51.8%, a difference of 0.12%), and Immigrants from Honduras (51.8%, a difference of 0.14%).
| Demographics | Rating | Rank | 2 or more Vehicles in Household |
| South Americans | 0.2 /100 | #271 | Tragic 51.9% |
| Sub-Saharan Africans | 0.2 /100 | #272 | Tragic 51.9% |
| Israelis | 0.2 /100 | #273 | Tragic 51.9% |
| Africans | 0.2 /100 | #274 | Tragic 51.8% |
| Immigrants | Honduras | 0.2 /100 | #275 | Tragic 51.8% |
| Immigrants | Croatia | 0.2 /100 | #276 | Tragic 51.8% |
| Immigrants | Africa | 0.2 /100 | #277 | Tragic 51.8% |
| Yuman | 0.1 /100 | #278 | Tragic 51.7% |
| Liberians | 0.1 /100 | #279 | Tragic 51.7% |
| Immigrants | Eastern Europe | 0.1 /100 | #280 | Tragic 51.7% |
| Immigrants | Kazakhstan | 0.1 /100 | #281 | Tragic 51.6% |
| Bahamians | 0.1 /100 | #282 | Tragic 51.5% |
| Immigrants | China | 0.1 /100 | #283 | Tragic 51.5% |
| Immigrants | Zaire | 0.1 /100 | #284 | Tragic 51.5% |
| Immigrants | Uruguay | 0.1 /100 | #285 | Tragic 51.4% |