Cypriot vs Immigrants from Chile 1 or more Vehicles in Household
COMPARE
Cypriot
Immigrants from Chile
1 or more Vehicles in Household
1 or more Vehicles in Household Comparison
Cypriots
Immigrants from Chile
84.4%
1 OR MORE VEHICLES IN HOUSEHOLD
0.0/ 100
METRIC RATING
315th/ 347
METRIC RANK
89.1%
1 OR MORE VEHICLES IN HOUSEHOLD
14.4/ 100
METRIC RATING
208th/ 347
METRIC RANK
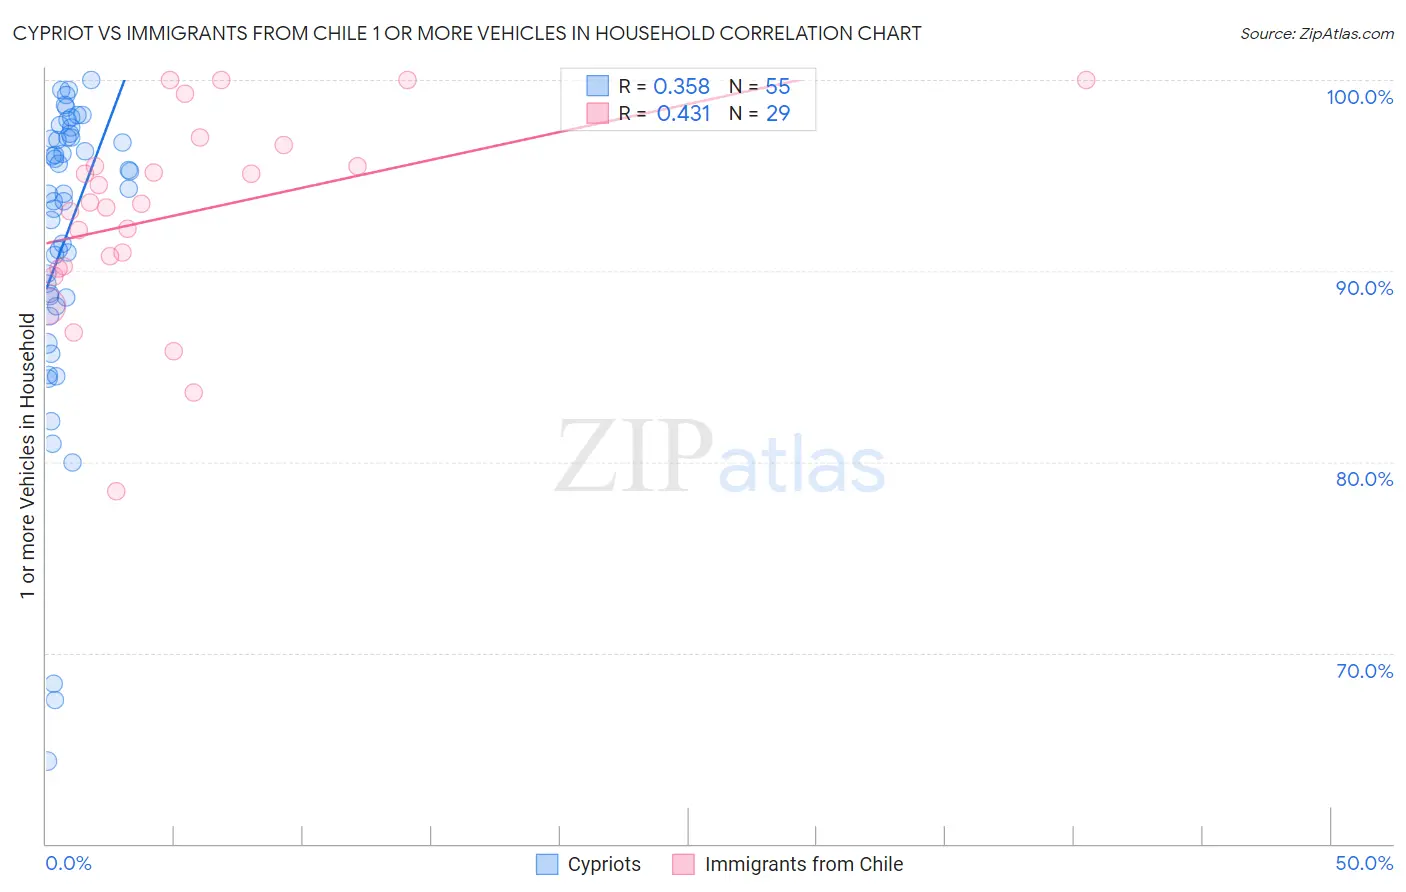
Cypriot vs Immigrants from Chile 1 or more Vehicles in Household Correlation Chart
The statistical analysis conducted on geographies consisting of 61,854,678 people shows a mild positive correlation between the proportion of Cypriots and percentage of households with 1 or more vehicles available in the United States with a correlation coefficient (R) of 0.358 and weighted average of 84.4%. Similarly, the statistical analysis conducted on geographies consisting of 218,611,230 people shows a moderate positive correlation between the proportion of Immigrants from Chile and percentage of households with 1 or more vehicles available in the United States with a correlation coefficient (R) of 0.431 and weighted average of 89.1%, a difference of 5.6%.
1 or more Vehicles in Household Correlation Summary
| Measurement | Cypriot | Immigrants from Chile |
| Minimum | 64.3% | 78.5% |
| Maximum | 100.0% | 100.0% |
| Range | 35.7% | 21.5% |
| Mean | 91.6% | 93.0% |
| Median | 94.0% | 93.5% |
| Interquartile 25% (IQ1) | 88.6% | 90.2% |
| Interquartile 75% (IQ3) | 97.0% | 96.0% |
| Interquartile Range (IQR) | 8.4% | 5.9% |
| Standard Deviation (Sample) | 8.0% | 5.2% |
| Standard Deviation (Population) | 7.9% | 5.1% |
Similar Demographics by 1 or more Vehicles in Household
Demographics Similar to Cypriots by 1 or more Vehicles in Household
In terms of 1 or more vehicles in household, the demographic groups most similar to Cypriots are Albanian (84.4%, a difference of 0.070%), Immigrants from Israel (84.5%, a difference of 0.13%), Cape Verdean (84.5%, a difference of 0.16%), Puerto Rican (84.6%, a difference of 0.27%), and U.S. Virgin Islander (84.6%, a difference of 0.30%).
| Demographics | Rating | Rank | 1 or more Vehicles in Household |
| Immigrants | Belize | 0.0 /100 | #308 | Tragic 84.7% |
| Immigrants | Haiti | 0.0 /100 | #309 | Tragic 84.7% |
| U.S. Virgin Islanders | 0.0 /100 | #310 | Tragic 84.6% |
| Puerto Ricans | 0.0 /100 | #311 | Tragic 84.6% |
| Cape Verdeans | 0.0 /100 | #312 | Tragic 84.5% |
| Immigrants | Israel | 0.0 /100 | #313 | Tragic 84.5% |
| Albanians | 0.0 /100 | #314 | Tragic 84.4% |
| Cypriots | 0.0 /100 | #315 | Tragic 84.4% |
| Alaska Natives | 0.0 /100 | #316 | Tragic 83.8% |
| Ghanaians | 0.0 /100 | #317 | Tragic 83.6% |
| Immigrants | Ghana | 0.0 /100 | #318 | Tragic 83.4% |
| Immigrants | Belarus | 0.0 /100 | #319 | Tragic 83.3% |
| Soviet Union | 0.0 /100 | #320 | Tragic 82.7% |
| Jamaicans | 0.0 /100 | #321 | Tragic 82.1% |
| Immigrants | Cabo Verde | 0.0 /100 | #322 | Tragic 81.6% |
Demographics Similar to Immigrants from Chile by 1 or more Vehicles in Household
In terms of 1 or more vehicles in household, the demographic groups most similar to Immigrants from Chile are Immigrants from Denmark (89.1%, a difference of 0.010%), Immigrants from Italy (89.1%, a difference of 0.010%), Dutch West Indian (89.0%, a difference of 0.030%), Apache (89.1%, a difference of 0.050%), and Sierra Leonean (89.0%, a difference of 0.050%).
| Demographics | Rating | Rank | 1 or more Vehicles in Household |
| Immigrants | Western Europe | 20.5 /100 | #201 | Fair 89.2% |
| Iroquois | 19.8 /100 | #202 | Poor 89.2% |
| Cambodians | 18.9 /100 | #203 | Poor 89.2% |
| Romanians | 18.2 /100 | #204 | Poor 89.2% |
| Guatemalans | 17.8 /100 | #205 | Poor 89.2% |
| Apache | 16.2 /100 | #206 | Poor 89.1% |
| Immigrants | Denmark | 14.8 /100 | #207 | Poor 89.1% |
| Immigrants | Chile | 14.4 /100 | #208 | Poor 89.1% |
| Immigrants | Italy | 14.0 /100 | #209 | Poor 89.1% |
| Dutch West Indians | 13.5 /100 | #210 | Poor 89.0% |
| Sierra Leoneans | 13.0 /100 | #211 | Poor 89.0% |
| Somalis | 12.8 /100 | #212 | Poor 89.0% |
| Immigrants | Western Asia | 12.3 /100 | #213 | Poor 89.0% |
| Immigrants | Hungary | 11.9 /100 | #214 | Poor 89.0% |
| Immigrants | Sri Lanka | 10.2 /100 | #215 | Poor 88.9% |