Hopi vs Immigrants from Turkey 1 or more Vehicles in Household
COMPARE
Hopi
Immigrants from Turkey
1 or more Vehicles in Household
1 or more Vehicles in Household Comparison
Hopi
Immigrants from Turkey
86.4%
1 OR MORE VEHICLES IN HOUSEHOLD
0.0/ 100
METRIC RATING
288th/ 347
METRIC RANK
88.6%
1 OR MORE VEHICLES IN HOUSEHOLD
4.4/ 100
METRIC RATING
237th/ 347
METRIC RANK
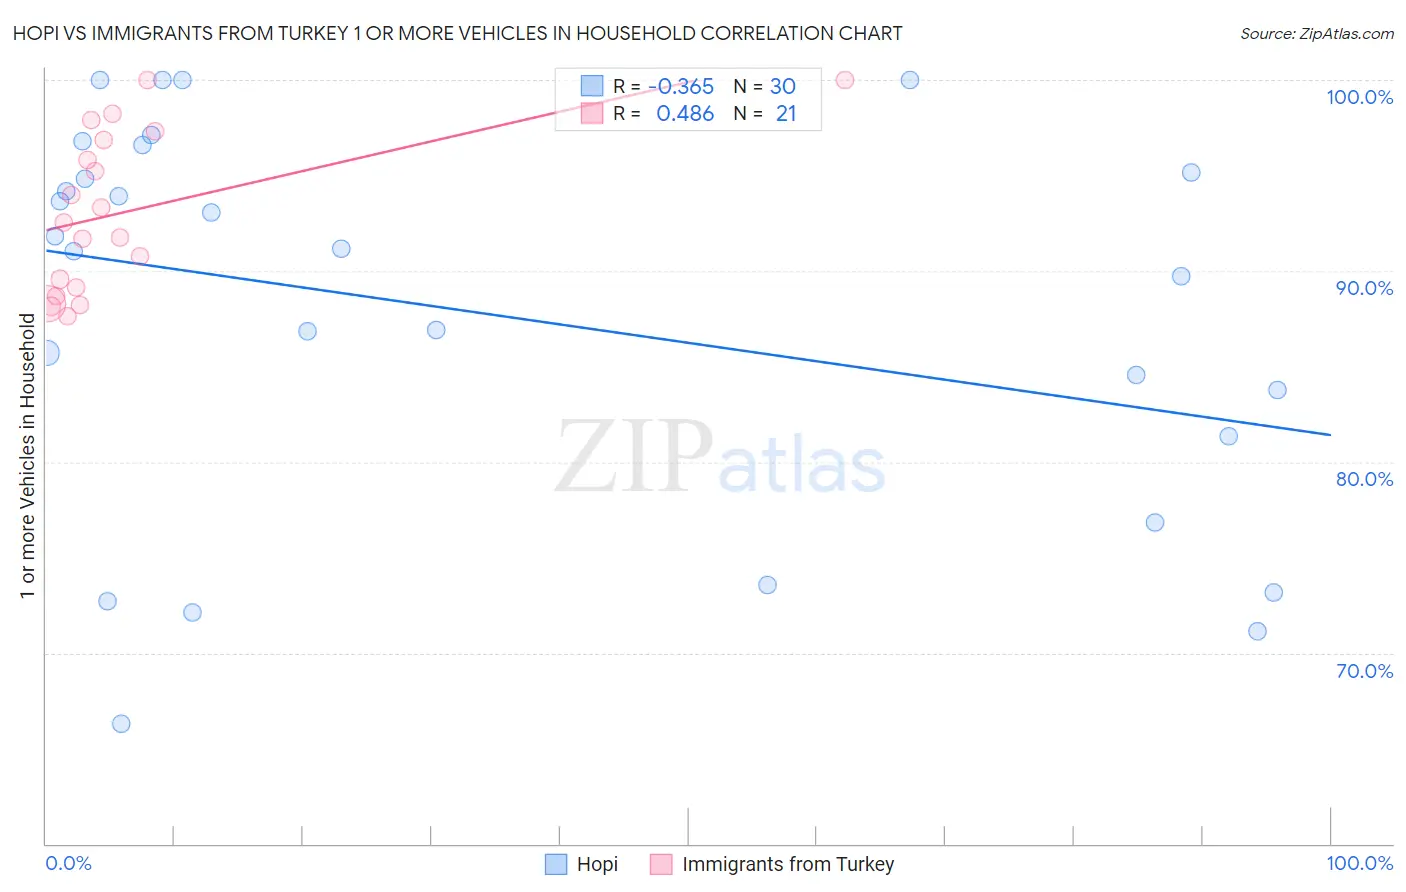
Hopi vs Immigrants from Turkey 1 or more Vehicles in Household Correlation Chart
The statistical analysis conducted on geographies consisting of 74,733,532 people shows a mild negative correlation between the proportion of Hopi and percentage of households with 1 or more vehicles available in the United States with a correlation coefficient (R) of -0.365 and weighted average of 86.4%. Similarly, the statistical analysis conducted on geographies consisting of 222,983,528 people shows a moderate positive correlation between the proportion of Immigrants from Turkey and percentage of households with 1 or more vehicles available in the United States with a correlation coefficient (R) of 0.486 and weighted average of 88.6%, a difference of 2.5%.
1 or more Vehicles in Household Correlation Summary
| Measurement | Hopi | Immigrants from Turkey |
| Minimum | 66.3% | 87.6% |
| Maximum | 100.0% | 100.0% |
| Range | 33.7% | 12.4% |
| Mean | 87.8% | 93.1% |
| Median | 91.1% | 92.5% |
| Interquartile 25% (IQ1) | 81.3% | 88.9% |
| Interquartile 75% (IQ3) | 95.2% | 97.1% |
| Interquartile Range (IQR) | 13.9% | 8.2% |
| Standard Deviation (Sample) | 10.1% | 4.2% |
| Standard Deviation (Population) | 9.9% | 4.1% |
Similar Demographics by 1 or more Vehicles in Household
Demographics Similar to Hopi by 1 or more Vehicles in Household
In terms of 1 or more vehicles in household, the demographic groups most similar to Hopi are Immigrants from Ireland (86.4%, a difference of 0.020%), Immigrants from Australia (86.4%, a difference of 0.060%), Immigrants from Malaysia (86.5%, a difference of 0.070%), Pima (86.3%, a difference of 0.14%), and Immigrants from Eastern Asia (86.5%, a difference of 0.15%).
| Demographics | Rating | Rank | 1 or more Vehicles in Household |
| Mongolians | 0.0 /100 | #281 | Tragic 87.0% |
| Colville | 0.0 /100 | #282 | Tragic 86.8% |
| Immigrants | Eastern Europe | 0.0 /100 | #283 | Tragic 86.7% |
| Central American Indians | 0.0 /100 | #284 | Tragic 86.7% |
| Immigrants | Kazakhstan | 0.0 /100 | #285 | Tragic 86.6% |
| Immigrants | Eastern Asia | 0.0 /100 | #286 | Tragic 86.5% |
| Immigrants | Malaysia | 0.0 /100 | #287 | Tragic 86.5% |
| Hopi | 0.0 /100 | #288 | Tragic 86.4% |
| Immigrants | Ireland | 0.0 /100 | #289 | Tragic 86.4% |
| Immigrants | Australia | 0.0 /100 | #290 | Tragic 86.4% |
| Pima | 0.0 /100 | #291 | Tragic 86.3% |
| Okinawans | 0.0 /100 | #292 | Tragic 86.1% |
| Indians (Asian) | 0.0 /100 | #293 | Tragic 86.0% |
| Alaskan Athabascans | 0.0 /100 | #294 | Tragic 86.0% |
| Immigrants | Jamaica | 0.0 /100 | #295 | Tragic 85.8% |
Demographics Similar to Immigrants from Turkey by 1 or more Vehicles in Household
In terms of 1 or more vehicles in household, the demographic groups most similar to Immigrants from Turkey are Immigrants from Pakistan (88.6%, a difference of 0.010%), Paiute (88.6%, a difference of 0.020%), Immigrants from Somalia (88.6%, a difference of 0.020%), Immigrants from Peru (88.6%, a difference of 0.030%), and Houma (88.6%, a difference of 0.040%).
| Demographics | Rating | Rank | 1 or more Vehicles in Household |
| Immigrants | Sierra Leone | 5.2 /100 | #230 | Tragic 88.7% |
| Russians | 5.0 /100 | #231 | Tragic 88.7% |
| Immigrants | Japan | 4.9 /100 | #232 | Tragic 88.7% |
| Houma | 4.8 /100 | #233 | Tragic 88.6% |
| Immigrants | Peru | 4.7 /100 | #234 | Tragic 88.6% |
| Paiute | 4.6 /100 | #235 | Tragic 88.6% |
| Immigrants | Pakistan | 4.5 /100 | #236 | Tragic 88.6% |
| Immigrants | Turkey | 4.4 /100 | #237 | Tragic 88.6% |
| Immigrants | Somalia | 4.2 /100 | #238 | Tragic 88.6% |
| Kiowa | 3.8 /100 | #239 | Tragic 88.6% |
| Eastern Europeans | 3.0 /100 | #240 | Tragic 88.5% |
| Taiwanese | 2.6 /100 | #241 | Tragic 88.4% |
| Turks | 2.5 /100 | #242 | Tragic 88.4% |
| Immigrants | Belgium | 2.1 /100 | #243 | Tragic 88.4% |
| Immigrants | Portugal | 2.0 /100 | #244 | Tragic 88.3% |