Hopi vs Spanish American Indian 1 or more Vehicles in Household
COMPARE
Hopi
Spanish American Indian
1 or more Vehicles in Household
1 or more Vehicles in Household Comparison
Hopi
Spanish American Indians
86.4%
1 OR MORE VEHICLES IN HOUSEHOLD
0.0/ 100
METRIC RATING
288th/ 347
METRIC RANK
89.9%
1 OR MORE VEHICLES IN HOUSEHOLD
67.0/ 100
METRIC RATING
162nd/ 347
METRIC RANK
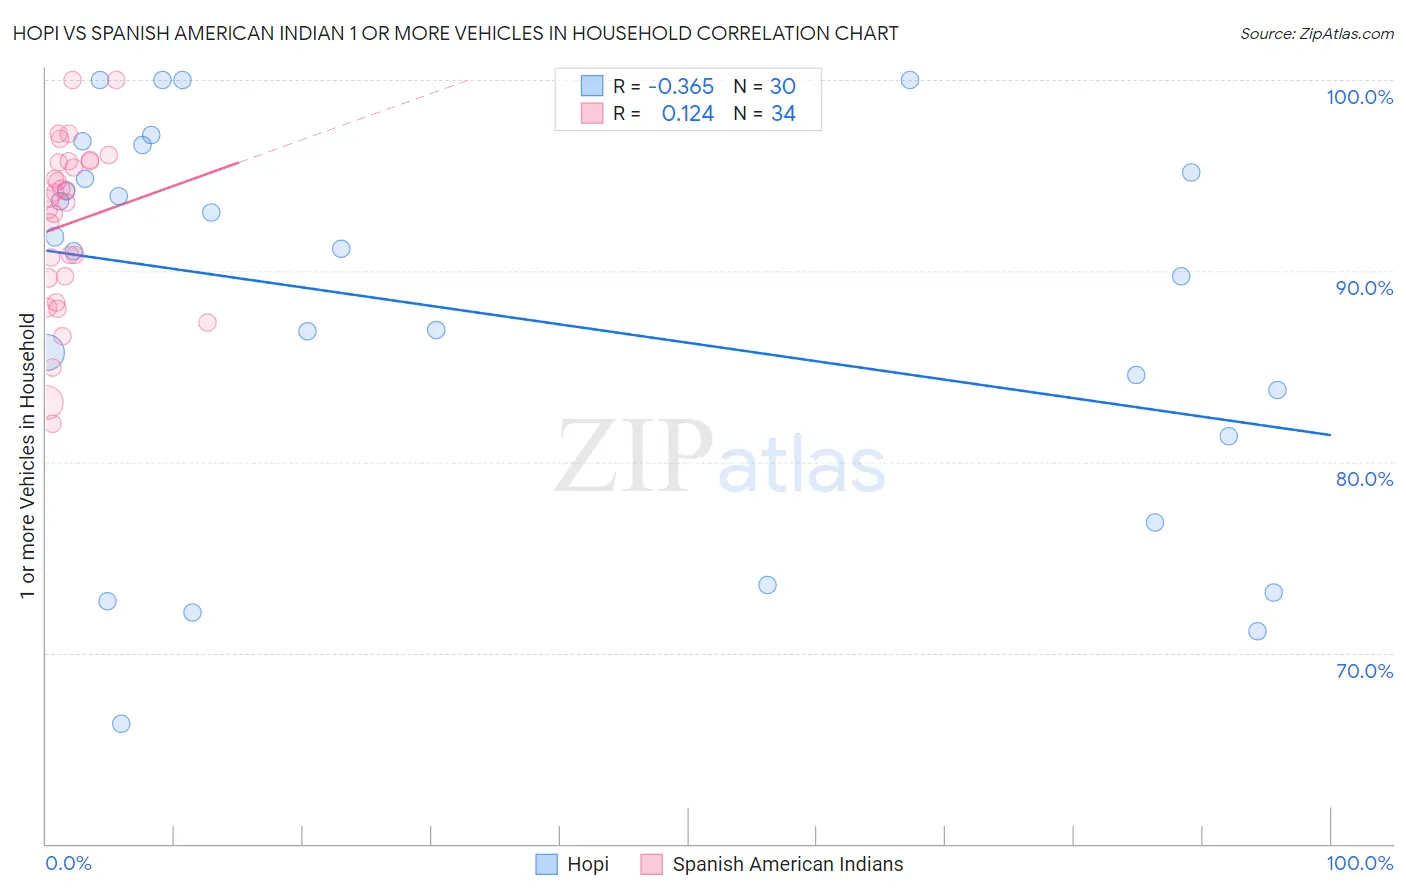
Hopi vs Spanish American Indian 1 or more Vehicles in Household Correlation Chart
The statistical analysis conducted on geographies consisting of 74,733,532 people shows a mild negative correlation between the proportion of Hopi and percentage of households with 1 or more vehicles available in the United States with a correlation coefficient (R) of -0.365 and weighted average of 86.4%. Similarly, the statistical analysis conducted on geographies consisting of 73,137,996 people shows a poor positive correlation between the proportion of Spanish American Indians and percentage of households with 1 or more vehicles available in the United States with a correlation coefficient (R) of 0.124 and weighted average of 89.9%, a difference of 4.1%.
1 or more Vehicles in Household Correlation Summary
| Measurement | Hopi | Spanish American Indian |
| Minimum | 66.3% | 82.0% |
| Maximum | 100.0% | 100.0% |
| Range | 33.7% | 18.0% |
| Mean | 87.8% | 92.5% |
| Median | 91.1% | 93.7% |
| Interquartile 25% (IQ1) | 81.3% | 89.6% |
| Interquartile 75% (IQ3) | 95.2% | 95.7% |
| Interquartile Range (IQR) | 13.9% | 6.1% |
| Standard Deviation (Sample) | 10.1% | 4.5% |
| Standard Deviation (Population) | 9.9% | 4.4% |
Similar Demographics by 1 or more Vehicles in Household
Demographics Similar to Hopi by 1 or more Vehicles in Household
In terms of 1 or more vehicles in household, the demographic groups most similar to Hopi are Immigrants from Ireland (86.4%, a difference of 0.020%), Immigrants from Australia (86.4%, a difference of 0.060%), Immigrants from Malaysia (86.5%, a difference of 0.070%), Pima (86.3%, a difference of 0.14%), and Immigrants from Eastern Asia (86.5%, a difference of 0.15%).
| Demographics | Rating | Rank | 1 or more Vehicles in Household |
| Mongolians | 0.0 /100 | #281 | Tragic 87.0% |
| Colville | 0.0 /100 | #282 | Tragic 86.8% |
| Immigrants | Eastern Europe | 0.0 /100 | #283 | Tragic 86.7% |
| Central American Indians | 0.0 /100 | #284 | Tragic 86.7% |
| Immigrants | Kazakhstan | 0.0 /100 | #285 | Tragic 86.6% |
| Immigrants | Eastern Asia | 0.0 /100 | #286 | Tragic 86.5% |
| Immigrants | Malaysia | 0.0 /100 | #287 | Tragic 86.5% |
| Hopi | 0.0 /100 | #288 | Tragic 86.4% |
| Immigrants | Ireland | 0.0 /100 | #289 | Tragic 86.4% |
| Immigrants | Australia | 0.0 /100 | #290 | Tragic 86.4% |
| Pima | 0.0 /100 | #291 | Tragic 86.3% |
| Okinawans | 0.0 /100 | #292 | Tragic 86.1% |
| Indians (Asian) | 0.0 /100 | #293 | Tragic 86.0% |
| Alaskan Athabascans | 0.0 /100 | #294 | Tragic 86.0% |
| Immigrants | Jamaica | 0.0 /100 | #295 | Tragic 85.8% |
Demographics Similar to Spanish American Indians by 1 or more Vehicles in Household
In terms of 1 or more vehicles in household, the demographic groups most similar to Spanish American Indians are Immigrants from Indonesia (90.0%, a difference of 0.030%), Salvadoran (90.0%, a difference of 0.030%), Immigrants from Austria (89.9%, a difference of 0.030%), South African (90.0%, a difference of 0.050%), and Comanche (89.9%, a difference of 0.060%).
| Demographics | Rating | Rank | 1 or more Vehicles in Household |
| Immigrants | Immigrants | 73.6 /100 | #155 | Good 90.1% |
| Australians | 72.4 /100 | #156 | Good 90.0% |
| Immigrants | Congo | 71.2 /100 | #157 | Good 90.0% |
| Brazilians | 71.0 /100 | #158 | Good 90.0% |
| South Africans | 69.7 /100 | #159 | Good 90.0% |
| Immigrants | Indonesia | 68.8 /100 | #160 | Good 90.0% |
| Salvadorans | 68.7 /100 | #161 | Good 90.0% |
| Spanish American Indians | 67.0 /100 | #162 | Good 89.9% |
| Immigrants | Austria | 65.5 /100 | #163 | Good 89.9% |
| Comanche | 63.4 /100 | #164 | Good 89.9% |
| Immigrants | Saudi Arabia | 62.6 /100 | #165 | Good 89.9% |
| Immigrants | Middle Africa | 62.2 /100 | #166 | Good 89.9% |
| Immigrants | Latin America | 60.3 /100 | #167 | Good 89.8% |
| Immigrants | Cambodia | 60.1 /100 | #168 | Good 89.8% |
| Natives/Alaskans | 59.5 /100 | #169 | Average 89.8% |