Hopi vs Japanese 1 or more Vehicles in Household
COMPARE
Hopi
Japanese
1 or more Vehicles in Household
1 or more Vehicles in Household Comparison
Hopi
Japanese
86.4%
1 OR MORE VEHICLES IN HOUSEHOLD
0.0/ 100
METRIC RATING
288th/ 347
METRIC RANK
90.6%
1 OR MORE VEHICLES IN HOUSEHOLD
93.4/ 100
METRIC RATING
118th/ 347
METRIC RANK
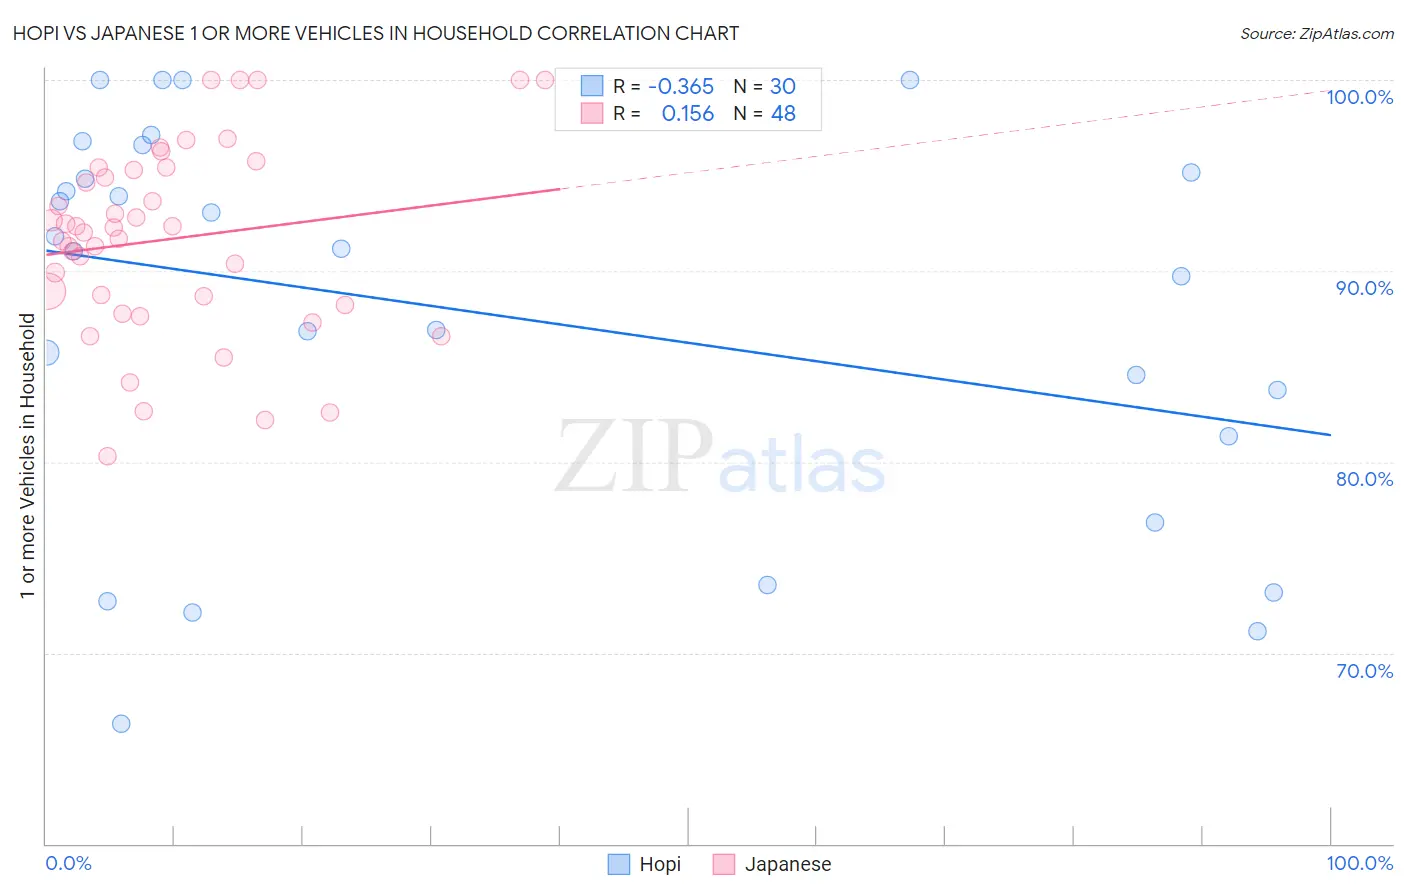
Hopi vs Japanese 1 or more Vehicles in Household Correlation Chart
The statistical analysis conducted on geographies consisting of 74,733,532 people shows a mild negative correlation between the proportion of Hopi and percentage of households with 1 or more vehicles available in the United States with a correlation coefficient (R) of -0.365 and weighted average of 86.4%. Similarly, the statistical analysis conducted on geographies consisting of 249,114,886 people shows a poor positive correlation between the proportion of Japanese and percentage of households with 1 or more vehicles available in the United States with a correlation coefficient (R) of 0.156 and weighted average of 90.6%, a difference of 4.9%.
1 or more Vehicles in Household Correlation Summary
| Measurement | Hopi | Japanese |
| Minimum | 66.3% | 80.3% |
| Maximum | 100.0% | 100.0% |
| Range | 33.7% | 19.7% |
| Mean | 87.8% | 91.7% |
| Median | 91.1% | 92.1% |
| Interquartile 25% (IQ1) | 81.3% | 88.4% |
| Interquartile 75% (IQ3) | 95.2% | 95.3% |
| Interquartile Range (IQR) | 13.9% | 6.9% |
| Standard Deviation (Sample) | 10.1% | 5.0% |
| Standard Deviation (Population) | 9.9% | 4.9% |
Similar Demographics by 1 or more Vehicles in Household
Demographics Similar to Hopi by 1 or more Vehicles in Household
In terms of 1 or more vehicles in household, the demographic groups most similar to Hopi are Immigrants from Ireland (86.4%, a difference of 0.020%), Immigrants from Australia (86.4%, a difference of 0.060%), Immigrants from Malaysia (86.5%, a difference of 0.070%), Pima (86.3%, a difference of 0.14%), and Immigrants from Eastern Asia (86.5%, a difference of 0.15%).
| Demographics | Rating | Rank | 1 or more Vehicles in Household |
| Mongolians | 0.0 /100 | #281 | Tragic 87.0% |
| Colville | 0.0 /100 | #282 | Tragic 86.8% |
| Immigrants | Eastern Europe | 0.0 /100 | #283 | Tragic 86.7% |
| Central American Indians | 0.0 /100 | #284 | Tragic 86.7% |
| Immigrants | Kazakhstan | 0.0 /100 | #285 | Tragic 86.6% |
| Immigrants | Eastern Asia | 0.0 /100 | #286 | Tragic 86.5% |
| Immigrants | Malaysia | 0.0 /100 | #287 | Tragic 86.5% |
| Hopi | 0.0 /100 | #288 | Tragic 86.4% |
| Immigrants | Ireland | 0.0 /100 | #289 | Tragic 86.4% |
| Immigrants | Australia | 0.0 /100 | #290 | Tragic 86.4% |
| Pima | 0.0 /100 | #291 | Tragic 86.3% |
| Okinawans | 0.0 /100 | #292 | Tragic 86.1% |
| Indians (Asian) | 0.0 /100 | #293 | Tragic 86.0% |
| Alaskan Athabascans | 0.0 /100 | #294 | Tragic 86.0% |
| Immigrants | Jamaica | 0.0 /100 | #295 | Tragic 85.8% |
Demographics Similar to Japanese by 1 or more Vehicles in Household
In terms of 1 or more vehicles in household, the demographic groups most similar to Japanese are Greek (90.6%, a difference of 0.010%), Blackfeet (90.6%, a difference of 0.050%), Serbian (90.7%, a difference of 0.060%), Chippewa (90.7%, a difference of 0.060%), and Immigrants from Thailand (90.6%, a difference of 0.070%).
| Demographics | Rating | Rank | 1 or more Vehicles in Household |
| Navajo | 95.8 /100 | #111 | Exceptional 90.8% |
| Immigrants | Netherlands | 95.7 /100 | #112 | Exceptional 90.8% |
| Immigrants | Kuwait | 94.7 /100 | #113 | Exceptional 90.7% |
| Armenians | 94.5 /100 | #114 | Exceptional 90.7% |
| Serbians | 94.3 /100 | #115 | Exceptional 90.7% |
| Chippewa | 94.3 /100 | #116 | Exceptional 90.7% |
| Greeks | 93.5 /100 | #117 | Exceptional 90.6% |
| Japanese | 93.4 /100 | #118 | Exceptional 90.6% |
| Blackfeet | 92.6 /100 | #119 | Exceptional 90.6% |
| Immigrants | Thailand | 92.3 /100 | #120 | Exceptional 90.6% |
| Icelanders | 92.1 /100 | #121 | Exceptional 90.5% |
| Costa Ricans | 92.0 /100 | #122 | Exceptional 90.5% |
| Fijians | 91.8 /100 | #123 | Exceptional 90.5% |
| Puget Sound Salish | 91.5 /100 | #124 | Exceptional 90.5% |
| Immigrants | Korea | 90.5 /100 | #125 | Exceptional 90.5% |