Honduran vs Immigrants from Sudan Single Mother Households
COMPARE
Honduran
Immigrants from Sudan
Single Mother Households
Single Mother Households Comparison
Hondurans
Immigrants from Sudan
8.1%
SINGLE MOTHER HOUSEHOLDS
0.0/ 100
METRIC RATING
310th/ 347
METRIC RANK
6.9%
SINGLE MOTHER HOUSEHOLDS
3.5/ 100
METRIC RATING
224th/ 347
METRIC RANK
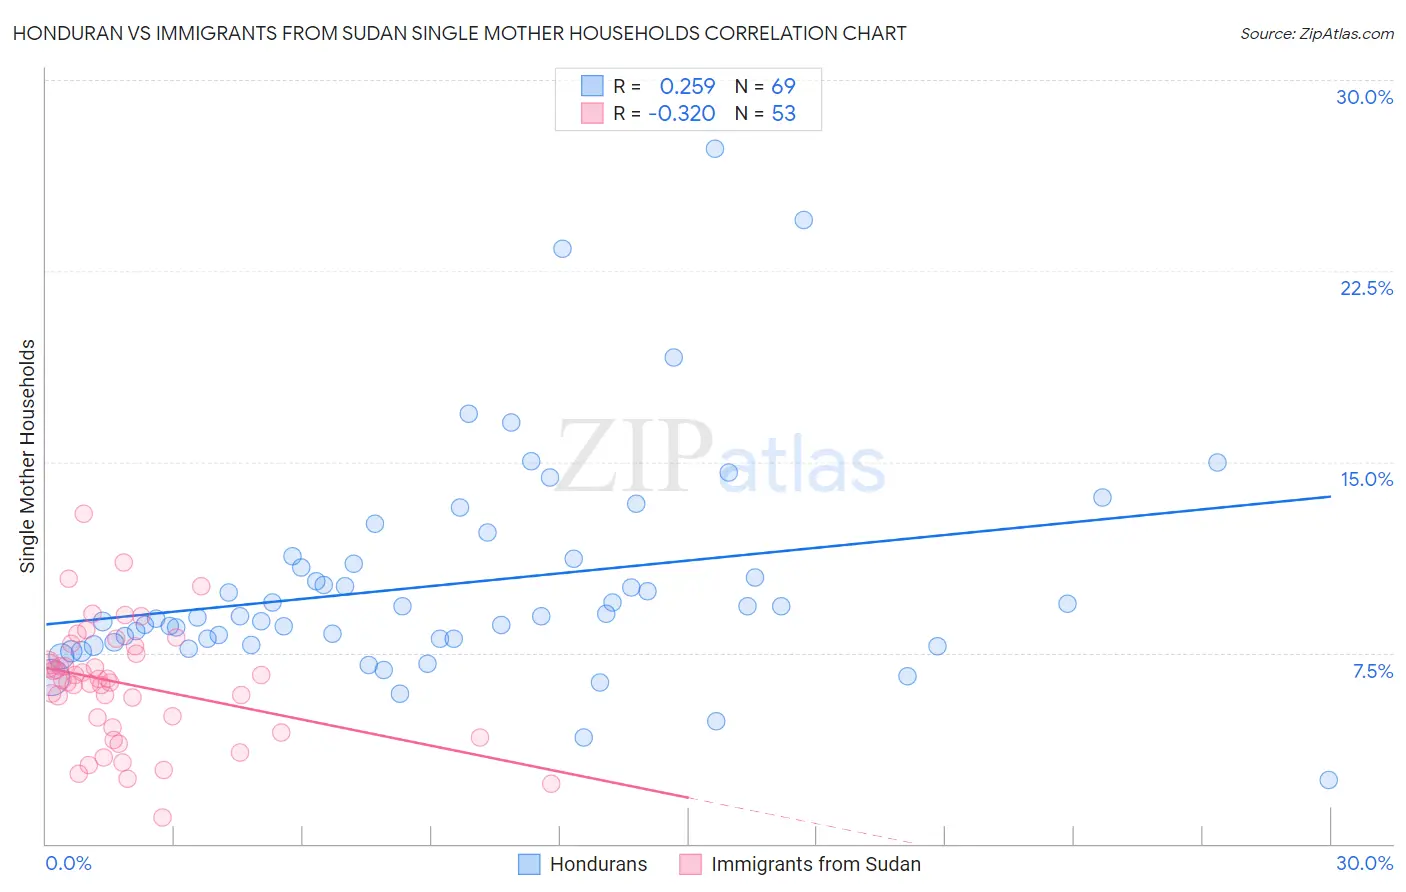
Honduran vs Immigrants from Sudan Single Mother Households Correlation Chart
The statistical analysis conducted on geographies consisting of 357,144,636 people shows a weak positive correlation between the proportion of Hondurans and percentage of single mother households in the United States with a correlation coefficient (R) of 0.259 and weighted average of 8.1%. Similarly, the statistical analysis conducted on geographies consisting of 118,904,005 people shows a mild negative correlation between the proportion of Immigrants from Sudan and percentage of single mother households in the United States with a correlation coefficient (R) of -0.320 and weighted average of 6.9%, a difference of 17.5%.
Single Mother Households Correlation Summary
| Measurement | Honduran | Immigrants from Sudan |
| Minimum | 2.5% | 1.0% |
| Maximum | 27.3% | 13.0% |
| Range | 24.8% | 11.9% |
| Mean | 10.2% | 6.3% |
| Median | 8.9% | 6.5% |
| Interquartile 25% (IQ1) | 7.9% | 4.5% |
| Interquartile 75% (IQ3) | 11.1% | 7.6% |
| Interquartile Range (IQR) | 3.2% | 3.1% |
| Standard Deviation (Sample) | 4.4% | 2.4% |
| Standard Deviation (Population) | 4.3% | 2.3% |
Similar Demographics by Single Mother Households
Demographics Similar to Hondurans by Single Mother Households
In terms of single mother households, the demographic groups most similar to Hondurans are Cheyenne (8.1%, a difference of 0.050%), Immigrants from Congo (8.1%, a difference of 0.29%), Immigrants from Central America (8.1%, a difference of 0.50%), Immigrants from St. Vincent and the Grenadines (8.0%, a difference of 0.51%), and Bangladeshi (8.1%, a difference of 0.59%).
| Demographics | Rating | Rank | Single Mother Households |
| Immigrants | Bahamas | 0.0 /100 | #303 | Tragic 8.0% |
| Natives/Alaskans | 0.0 /100 | #304 | Tragic 8.0% |
| Colville | 0.0 /100 | #305 | Tragic 8.0% |
| Immigrants | Barbados | 0.0 /100 | #306 | Tragic 8.0% |
| Immigrants | St. Vincent and the Grenadines | 0.0 /100 | #307 | Tragic 8.0% |
| Immigrants | Central America | 0.0 /100 | #308 | Tragic 8.1% |
| Cheyenne | 0.0 /100 | #309 | Tragic 8.1% |
| Hondurans | 0.0 /100 | #310 | Tragic 8.1% |
| Immigrants | Congo | 0.0 /100 | #311 | Tragic 8.1% |
| Bangladeshis | 0.0 /100 | #312 | Tragic 8.1% |
| Immigrants | Grenada | 0.0 /100 | #313 | Tragic 8.2% |
| Immigrants | Mexico | 0.0 /100 | #314 | Tragic 8.2% |
| Immigrants | Western Africa | 0.0 /100 | #315 | Tragic 8.2% |
| Africans | 0.0 /100 | #316 | Tragic 8.2% |
| Immigrants | Honduras | 0.0 /100 | #317 | Tragic 8.2% |
Demographics Similar to Immigrants from Sudan by Single Mother Households
In terms of single mother households, the demographic groups most similar to Immigrants from Sudan are Immigrants from Micronesia (6.9%, a difference of 0.12%), Immigrants from Bangladesh (6.9%, a difference of 0.17%), French American Indian (6.9%, a difference of 0.19%), Sudanese (6.9%, a difference of 0.27%), and Immigrants from Thailand (6.9%, a difference of 0.39%).
| Demographics | Rating | Rank | Single Mother Households |
| Aleuts | 4.8 /100 | #217 | Tragic 6.8% |
| Immigrants | Eastern Africa | 4.4 /100 | #218 | Tragic 6.8% |
| Immigrants | Immigrants | 4.3 /100 | #219 | Tragic 6.8% |
| Immigrants | Thailand | 4.0 /100 | #220 | Tragic 6.9% |
| French American Indians | 3.7 /100 | #221 | Tragic 6.9% |
| Immigrants | Bangladesh | 3.7 /100 | #222 | Tragic 6.9% |
| Immigrants | Micronesia | 3.6 /100 | #223 | Tragic 6.9% |
| Immigrants | Sudan | 3.5 /100 | #224 | Tragic 6.9% |
| Sudanese | 3.1 /100 | #225 | Tragic 6.9% |
| Paiute | 2.4 /100 | #226 | Tragic 7.0% |
| Kenyans | 2.3 /100 | #227 | Tragic 7.0% |
| Iroquois | 2.2 /100 | #228 | Tragic 7.0% |
| Immigrants | Kenya | 2.1 /100 | #229 | Tragic 7.0% |
| Creek | 1.6 /100 | #230 | Tragic 7.0% |
| Spanish Americans | 1.6 /100 | #231 | Tragic 7.0% |