Asian vs Immigrants from Sudan 2 or more Vehicles in Household
COMPARE
Asian
Immigrants from Sudan
2 or more Vehicles in Household
2 or more Vehicles in Household Comparison
Asians
Immigrants from Sudan
57.0%
2 OR MORE VEHICLES IN HOUSEHOLD
95.1/ 100
METRIC RATING
118th/ 347
METRIC RANK
52.8%
2 OR MORE VEHICLES IN HOUSEHOLD
1.0/ 100
METRIC RATING
251st/ 347
METRIC RANK
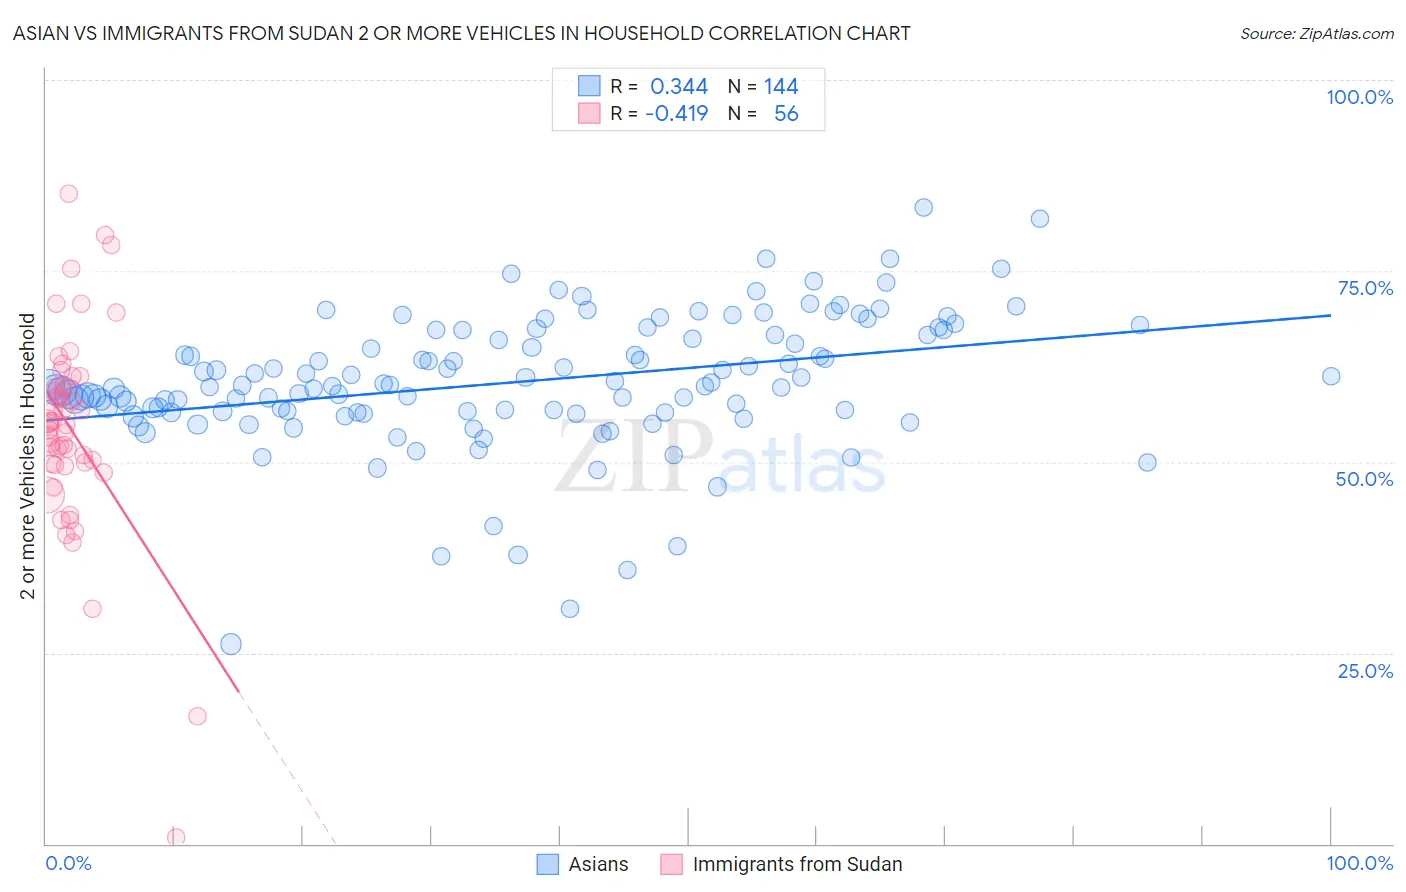
Asian vs Immigrants from Sudan 2 or more Vehicles in Household Correlation Chart
The statistical analysis conducted on geographies consisting of 550,191,593 people shows a mild positive correlation between the proportion of Asians and percentage of households with 2 or more vehicles available in the United States with a correlation coefficient (R) of 0.344 and weighted average of 57.0%. Similarly, the statistical analysis conducted on geographies consisting of 118,954,580 people shows a moderate negative correlation between the proportion of Immigrants from Sudan and percentage of households with 2 or more vehicles available in the United States with a correlation coefficient (R) of -0.419 and weighted average of 52.8%, a difference of 7.9%.
2 or more Vehicles in Household Correlation Summary
| Measurement | Asian | Immigrants from Sudan |
| Minimum | 26.1% | 0.83% |
| Maximum | 83.4% | 85.2% |
| Range | 57.2% | 84.3% |
| Mean | 60.5% | 54.2% |
| Median | 59.9% | 55.0% |
| Interquartile 25% (IQ1) | 56.5% | 49.7% |
| Interquartile 75% (IQ3) | 66.6% | 59.9% |
| Interquartile Range (IQR) | 10.1% | 10.2% |
| Standard Deviation (Sample) | 8.8% | 13.6% |
| Standard Deviation (Population) | 8.8% | 13.5% |
Similar Demographics by 2 or more Vehicles in Household
Demographics Similar to Asians by 2 or more Vehicles in Household
In terms of 2 or more vehicles in household, the demographic groups most similar to Asians are Native/Alaskan (57.0%, a difference of 0.030%), Costa Rican (56.9%, a difference of 0.070%), Iraqi (57.1%, a difference of 0.16%), Sioux (56.8%, a difference of 0.24%), and Immigrants from Jordan (57.2%, a difference of 0.36%).
| Demographics | Rating | Rank | 2 or more Vehicles in Household |
| Greeks | 98.0 /100 | #111 | Exceptional 57.5% |
| Pueblo | 98.0 /100 | #112 | Exceptional 57.5% |
| Zimbabweans | 96.9 /100 | #113 | Exceptional 57.2% |
| Immigrants | Lebanon | 96.8 /100 | #114 | Exceptional 57.2% |
| Chippewa | 96.6 /100 | #115 | Exceptional 57.2% |
| Immigrants | Jordan | 96.6 /100 | #116 | Exceptional 57.2% |
| Iraqis | 95.8 /100 | #117 | Exceptional 57.1% |
| Asians | 95.1 /100 | #118 | Exceptional 57.0% |
| Natives/Alaskans | 95.0 /100 | #119 | Exceptional 57.0% |
| Costa Ricans | 94.7 /100 | #120 | Exceptional 56.9% |
| Sioux | 93.8 /100 | #121 | Exceptional 56.8% |
| Immigrants | South Africa | 92.5 /100 | #122 | Exceptional 56.7% |
| Australians | 91.8 /100 | #123 | Exceptional 56.7% |
| New Zealanders | 91.8 /100 | #124 | Exceptional 56.7% |
| Tsimshian | 91.6 /100 | #125 | Exceptional 56.7% |
Demographics Similar to Immigrants from Sudan by 2 or more Vehicles in Household
In terms of 2 or more vehicles in household, the demographic groups most similar to Immigrants from Sudan are Immigrants from Portugal (52.8%, a difference of 0.010%), Mongolian (52.8%, a difference of 0.030%), Immigrants from Brazil (52.8%, a difference of 0.040%), Nigerian (52.8%, a difference of 0.060%), and Colombian (52.9%, a difference of 0.090%).
| Demographics | Rating | Rank | 2 or more Vehicles in Household |
| Indians (Asian) | 1.7 /100 | #244 | Tragic 53.1% |
| Immigrants | Ethiopia | 1.5 /100 | #245 | Tragic 53.0% |
| Immigrants | Nigeria | 1.2 /100 | #246 | Tragic 52.9% |
| Sierra Leoneans | 1.2 /100 | #247 | Tragic 52.9% |
| Colombians | 1.1 /100 | #248 | Tragic 52.9% |
| Immigrants | Brazil | 1.0 /100 | #249 | Tragic 52.8% |
| Mongolians | 1.0 /100 | #250 | Tragic 52.8% |
| Immigrants | Sudan | 1.0 /100 | #251 | Tragic 52.8% |
| Immigrants | Portugal | 1.0 /100 | #252 | Tragic 52.8% |
| Nigerians | 0.9 /100 | #253 | Tragic 52.8% |
| Immigrants | Malaysia | 0.8 /100 | #254 | Tragic 52.7% |
| Uruguayans | 0.7 /100 | #255 | Tragic 52.7% |
| Immigrants | Eritrea | 0.7 /100 | #256 | Tragic 52.6% |
| Immigrants | Hong Kong | 0.6 /100 | #257 | Tragic 52.6% |
| Central American Indians | 0.6 /100 | #258 | Tragic 52.5% |