Hispanic or Latino vs Aleut Unemployment Among Ages 16 to 19 years
COMPARE
Hispanic or Latino
Aleut
Unemployment Among Ages 16 to 19 years
Unemployment Among Ages 16 to 19 years Comparison
Hispanics or Latinos
Aleuts
19.2%
UNEMPLOYMENT AMONG AGES 16 TO 19 YEARS
0.0/ 100
METRIC RATING
272nd/ 347
METRIC RANK
21.2%
UNEMPLOYMENT AMONG AGES 16 TO 19 YEARS
0.0/ 100
METRIC RATING
304th/ 347
METRIC RANK
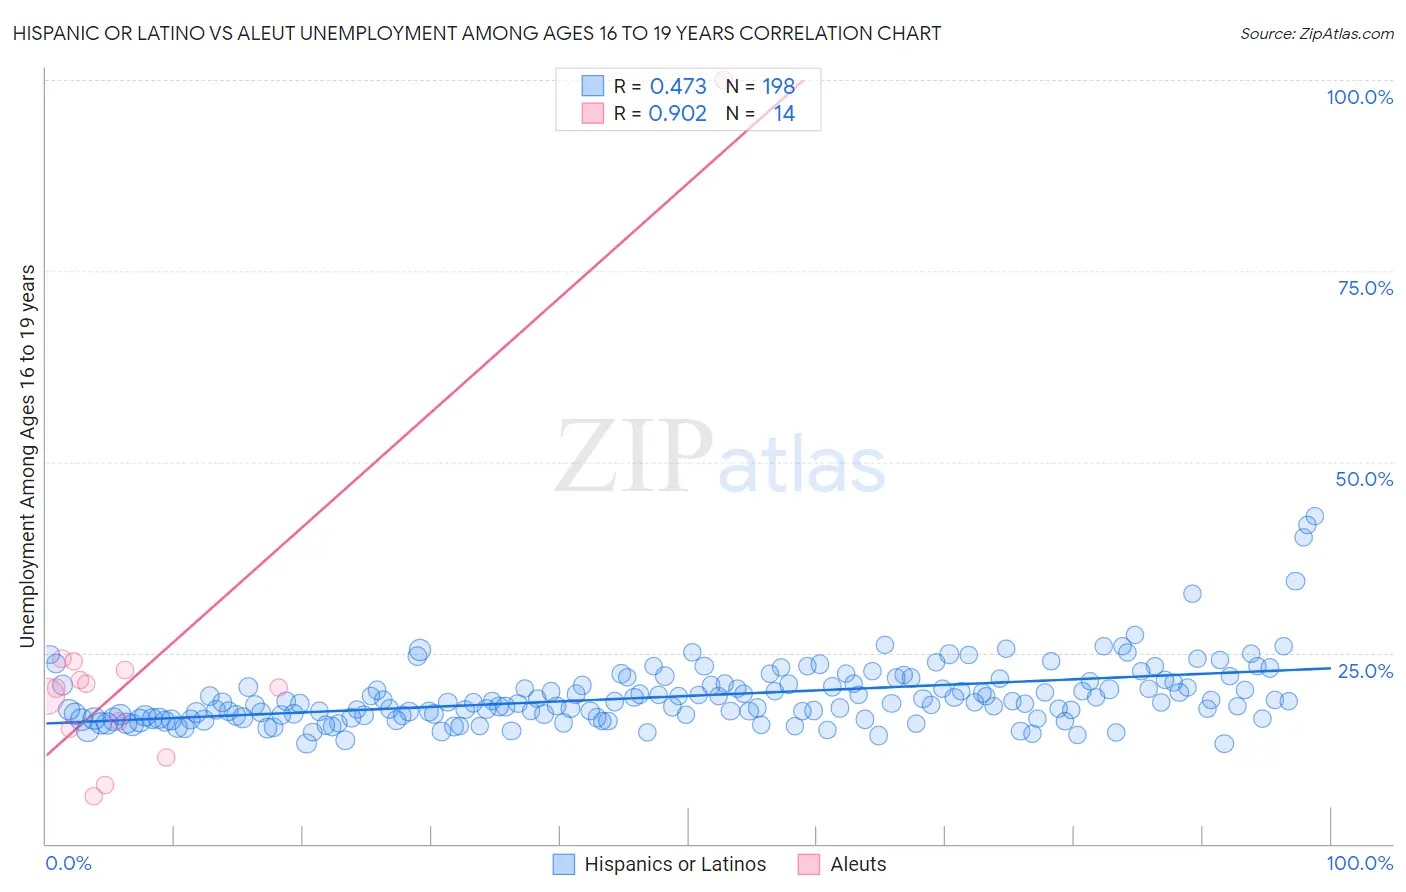
Hispanic or Latino vs Aleut Unemployment Among Ages 16 to 19 years Correlation Chart
The statistical analysis conducted on geographies consisting of 510,884,853 people shows a moderate positive correlation between the proportion of Hispanics or Latinos and unemployment rate among population between the ages 16 and 19 in the United States with a correlation coefficient (R) of 0.473 and weighted average of 19.2%. Similarly, the statistical analysis conducted on geographies consisting of 60,781,388 people shows a near-perfect positive correlation between the proportion of Aleuts and unemployment rate among population between the ages 16 and 19 in the United States with a correlation coefficient (R) of 0.902 and weighted average of 21.2%, a difference of 9.9%.
Unemployment Among Ages 16 to 19 years Correlation Summary
| Measurement | Hispanic or Latino | Aleut |
| Minimum | 13.1% | 6.2% |
| Maximum | 42.9% | 100.0% |
| Range | 29.7% | 93.8% |
| Mean | 19.3% | 23.6% |
| Median | 18.4% | 20.4% |
| Interquartile 25% (IQ1) | 16.4% | 15.1% |
| Interquartile 75% (IQ3) | 20.9% | 22.8% |
| Interquartile Range (IQR) | 4.4% | 7.7% |
| Standard Deviation (Sample) | 4.4% | 22.7% |
| Standard Deviation (Population) | 4.4% | 21.9% |
Similar Demographics by Unemployment Among Ages 16 to 19 years
Demographics Similar to Hispanics or Latinos by Unemployment Among Ages 16 to 19 years
In terms of unemployment among ages 16 to 19 years, the demographic groups most similar to Hispanics or Latinos are Blackfeet (19.2%, a difference of 0.12%), Immigrants from Panama (19.3%, a difference of 0.13%), Shoshone (19.3%, a difference of 0.28%), Honduran (19.2%, a difference of 0.50%), and Paraguayan (19.4%, a difference of 0.60%).
| Demographics | Rating | Rank | Unemployment Among Ages 16 to 19 years |
| Choctaw | 0.1 /100 | #265 | Tragic 19.0% |
| Immigrants | Honduras | 0.1 /100 | #266 | Tragic 19.0% |
| Israelis | 0.1 /100 | #267 | Tragic 19.0% |
| Immigrants | El Salvador | 0.1 /100 | #268 | Tragic 19.1% |
| Lumbee | 0.1 /100 | #269 | Tragic 19.1% |
| Hondurans | 0.1 /100 | #270 | Tragic 19.2% |
| Blackfeet | 0.0 /100 | #271 | Tragic 19.2% |
| Hispanics or Latinos | 0.0 /100 | #272 | Tragic 19.2% |
| Immigrants | Panama | 0.0 /100 | #273 | Tragic 19.3% |
| Shoshone | 0.0 /100 | #274 | Tragic 19.3% |
| Paraguayans | 0.0 /100 | #275 | Tragic 19.4% |
| Immigrants | Latin America | 0.0 /100 | #276 | Tragic 19.4% |
| Immigrants | Western Africa | 0.0 /100 | #277 | Tragic 19.4% |
| Africans | 0.0 /100 | #278 | Tragic 19.5% |
| Ute | 0.0 /100 | #279 | Tragic 19.6% |
Demographics Similar to Aleuts by Unemployment Among Ages 16 to 19 years
In terms of unemployment among ages 16 to 19 years, the demographic groups most similar to Aleuts are Immigrants from Senegal (21.2%, a difference of 0.16%), U.S. Virgin Islander (21.3%, a difference of 0.56%), Senegalese (21.0%, a difference of 0.86%), Black/African American (21.4%, a difference of 1.1%), and Immigrants from Caribbean (20.9%, a difference of 1.2%).
| Demographics | Rating | Rank | Unemployment Among Ages 16 to 19 years |
| Alsatians | 0.0 /100 | #297 | Tragic 20.5% |
| Haitians | 0.0 /100 | #298 | Tragic 20.5% |
| Immigrants | Uzbekistan | 0.0 /100 | #299 | Tragic 20.5% |
| Ecuadorians | 0.0 /100 | #300 | Tragic 20.5% |
| Immigrants | Ecuador | 0.0 /100 | #301 | Tragic 20.9% |
| Immigrants | Caribbean | 0.0 /100 | #302 | Tragic 20.9% |
| Senegalese | 0.0 /100 | #303 | Tragic 21.0% |
| Aleuts | 0.0 /100 | #304 | Tragic 21.2% |
| Immigrants | Senegal | 0.0 /100 | #305 | Tragic 21.2% |
| U.S. Virgin Islanders | 0.0 /100 | #306 | Tragic 21.3% |
| Blacks/African Americans | 0.0 /100 | #307 | Tragic 21.4% |
| Immigrants | Bangladesh | 0.0 /100 | #308 | Tragic 21.5% |
| Natives/Alaskans | 0.0 /100 | #309 | Tragic 21.5% |
| Vietnamese | 0.0 /100 | #310 | Tragic 21.5% |
| Belizeans | 0.0 /100 | #311 | Tragic 21.6% |