Hispanic or Latino vs Lebanese 1 or more Vehicles in Household
COMPARE
Hispanic or Latino
Lebanese
1 or more Vehicles in Household
1 or more Vehicles in Household Comparison
Hispanics or Latinos
Lebanese
91.0%
1 OR MORE VEHICLES IN HOUSEHOLD
97.6/ 100
METRIC RATING
108th/ 347
METRIC RANK
91.4%
1 OR MORE VEHICLES IN HOUSEHOLD
99.3/ 100
METRIC RATING
82nd/ 347
METRIC RANK
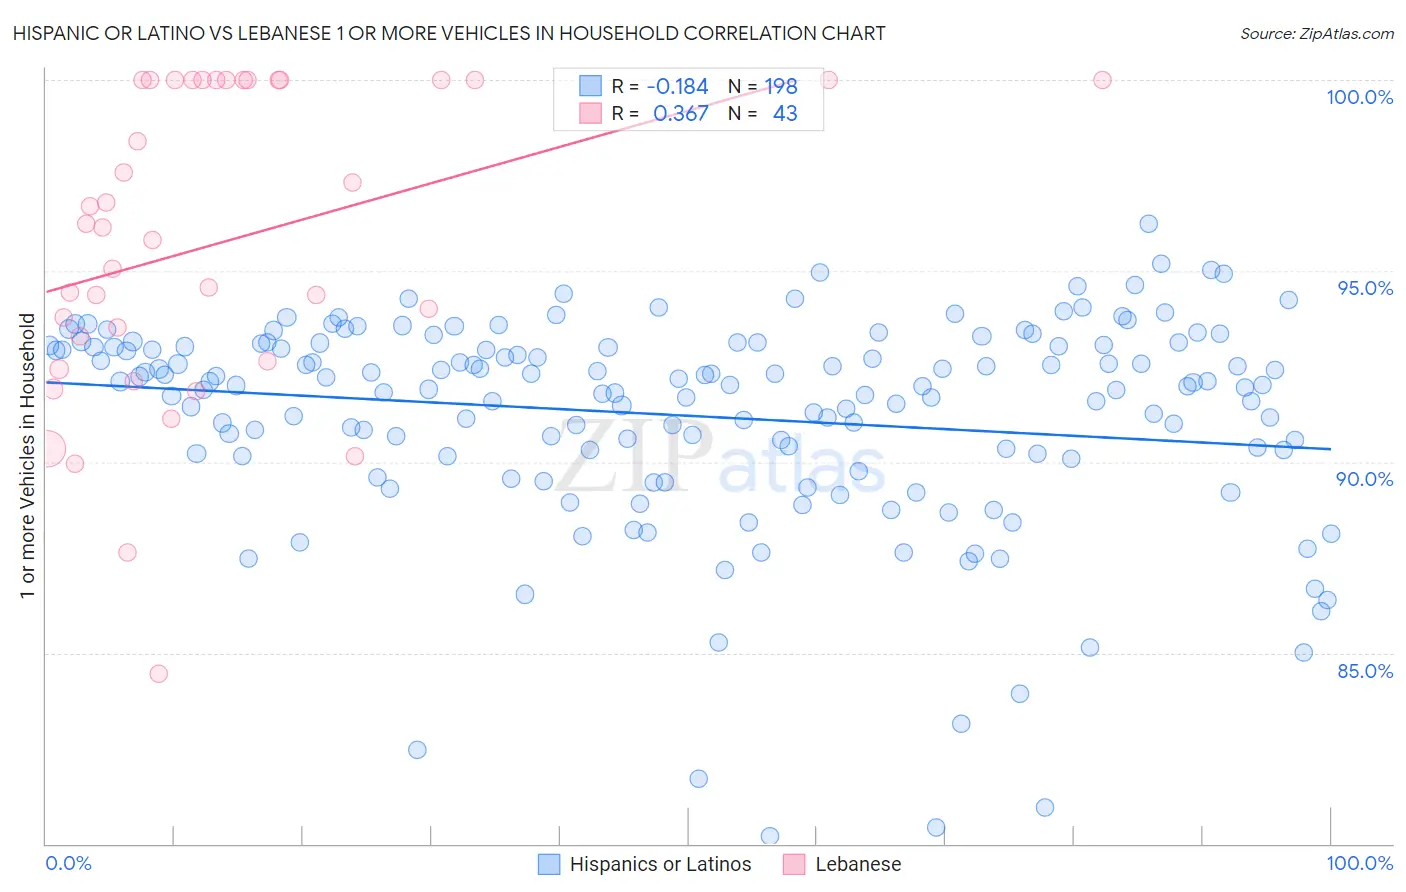
Hispanic or Latino vs Lebanese 1 or more Vehicles in Household Correlation Chart
The statistical analysis conducted on geographies consisting of 564,196,791 people shows a poor negative correlation between the proportion of Hispanics or Latinos and percentage of households with 1 or more vehicles available in the United States with a correlation coefficient (R) of -0.184 and weighted average of 91.0%. Similarly, the statistical analysis conducted on geographies consisting of 401,375,965 people shows a mild positive correlation between the proportion of Lebanese and percentage of households with 1 or more vehicles available in the United States with a correlation coefficient (R) of 0.367 and weighted average of 91.4%, a difference of 0.50%.
1 or more Vehicles in Household Correlation Summary
| Measurement | Hispanic or Latino | Lebanese |
| Minimum | 80.2% | 84.4% |
| Maximum | 96.2% | 100.0% |
| Range | 16.0% | 15.6% |
| Mean | 91.2% | 95.7% |
| Median | 92.0% | 96.1% |
| Interquartile 25% (IQ1) | 90.2% | 92.6% |
| Interquartile 75% (IQ3) | 93.0% | 100.0% |
| Interquartile Range (IQR) | 2.8% | 7.4% |
| Standard Deviation (Sample) | 2.8% | 4.0% |
| Standard Deviation (Population) | 2.8% | 4.0% |
Similar Demographics by 1 or more Vehicles in Household
Demographics Similar to Hispanics or Latinos by 1 or more Vehicles in Household
In terms of 1 or more vehicles in household, the demographic groups most similar to Hispanics or Latinos are Maltese (91.0%, a difference of 0.0%), Delaware (91.0%, a difference of 0.0%), Zimbabwean (91.0%, a difference of 0.020%), Mexican American Indian (91.0%, a difference of 0.030%), and Laotian (91.0%, a difference of 0.060%).
| Demographics | Rating | Rank | 1 or more Vehicles in Household |
| Bulgarians | 98.4 /100 | #101 | Exceptional 91.1% |
| Seminole | 98.3 /100 | #102 | Exceptional 91.1% |
| Yugoslavians | 98.3 /100 | #103 | Exceptional 91.1% |
| Asians | 98.2 /100 | #104 | Exceptional 91.1% |
| Laotians | 98.0 /100 | #105 | Exceptional 91.0% |
| Zimbabweans | 97.7 /100 | #106 | Exceptional 91.0% |
| Maltese | 97.7 /100 | #107 | Exceptional 91.0% |
| Hispanics or Latinos | 97.6 /100 | #108 | Exceptional 91.0% |
| Delaware | 97.6 /100 | #109 | Exceptional 91.0% |
| Mexican American Indians | 97.4 /100 | #110 | Exceptional 91.0% |
| Navajo | 95.8 /100 | #111 | Exceptional 90.8% |
| Immigrants | Netherlands | 95.7 /100 | #112 | Exceptional 90.8% |
| Immigrants | Kuwait | 94.7 /100 | #113 | Exceptional 90.7% |
| Armenians | 94.5 /100 | #114 | Exceptional 90.7% |
| Serbians | 94.3 /100 | #115 | Exceptional 90.7% |
Demographics Similar to Lebanese by 1 or more Vehicles in Household
In terms of 1 or more vehicles in household, the demographic groups most similar to Lebanese are Immigrants from England (91.4%, a difference of 0.0%), Immigrants from South Eastern Asia (91.4%, a difference of 0.010%), Jordanian (91.4%, a difference of 0.020%), Tsimshian (91.4%, a difference of 0.020%), and Immigrants from South Central Asia (91.5%, a difference of 0.040%).
| Demographics | Rating | Rank | 1 or more Vehicles in Household |
| Portuguese | 99.5 /100 | #75 | Exceptional 91.6% |
| Cubans | 99.5 /100 | #76 | Exceptional 91.5% |
| Immigrants | Philippines | 99.4 /100 | #77 | Exceptional 91.5% |
| Iranians | 99.4 /100 | #78 | Exceptional 91.5% |
| Immigrants | South Central Asia | 99.4 /100 | #79 | Exceptional 91.5% |
| Bolivians | 99.4 /100 | #80 | Exceptional 91.5% |
| Immigrants | South Eastern Asia | 99.3 /100 | #81 | Exceptional 91.4% |
| Lebanese | 99.3 /100 | #82 | Exceptional 91.4% |
| Immigrants | England | 99.3 /100 | #83 | Exceptional 91.4% |
| Jordanians | 99.3 /100 | #84 | Exceptional 91.4% |
| Tsimshian | 99.3 /100 | #85 | Exceptional 91.4% |
| Osage | 99.2 /100 | #86 | Exceptional 91.4% |
| Immigrants | Germany | 99.2 /100 | #87 | Exceptional 91.4% |
| Spanish Americans | 99.2 /100 | #88 | Exceptional 91.4% |
| Bangladeshis | 99.2 /100 | #89 | Exceptional 91.4% |