Greek vs Immigrants from Bulgaria Married-couple Households
COMPARE
Greek
Immigrants from Bulgaria
Married-couple Households
Married-couple Households Comparison
Greeks
Immigrants from Bulgaria
48.9%
MARRIED-COUPLE HOUSEHOLDS
99.7/ 100
METRIC RATING
38th/ 347
METRIC RANK
47.0%
MARRIED-COUPLE HOUSEHOLDS
76.8/ 100
METRIC RATING
151st/ 347
METRIC RANK
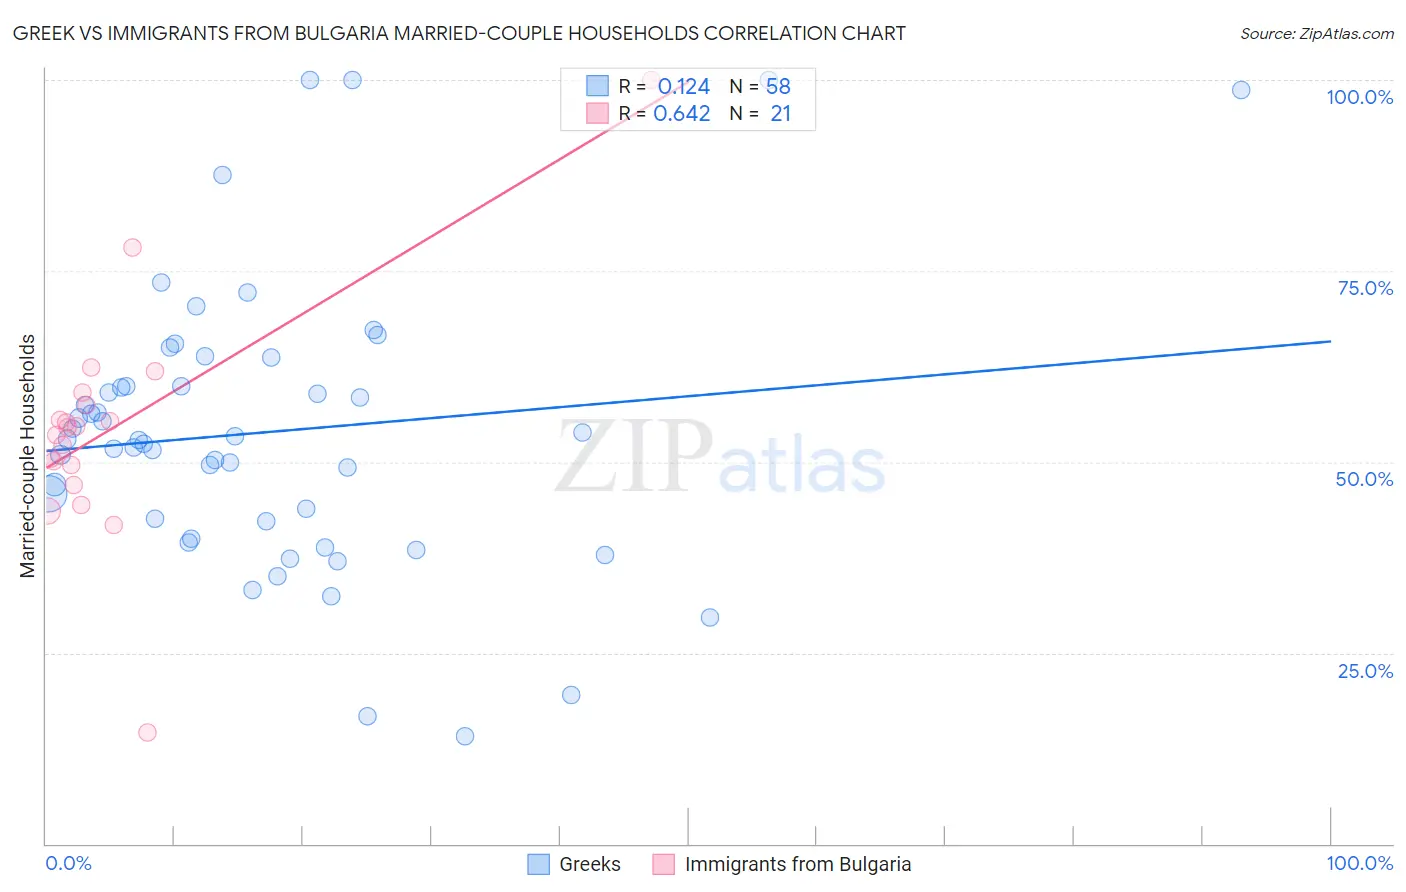
Greek vs Immigrants from Bulgaria Married-couple Households Correlation Chart
The statistical analysis conducted on geographies consisting of 482,332,211 people shows a poor positive correlation between the proportion of Greeks and percentage of married-couple family households in the United States with a correlation coefficient (R) of 0.124 and weighted average of 48.9%. Similarly, the statistical analysis conducted on geographies consisting of 172,541,029 people shows a significant positive correlation between the proportion of Immigrants from Bulgaria and percentage of married-couple family households in the United States with a correlation coefficient (R) of 0.642 and weighted average of 47.0%, a difference of 4.2%.
Married-couple Households Correlation Summary
| Measurement | Greek | Immigrants from Bulgaria |
| Minimum | 14.1% | 14.5% |
| Maximum | 100.0% | 100.0% |
| Range | 85.9% | 85.5% |
| Mean | 53.9% | 54.3% |
| Median | 53.0% | 54.5% |
| Interquartile 25% (IQ1) | 42.3% | 48.2% |
| Interquartile 75% (IQ3) | 60.0% | 58.2% |
| Interquartile Range (IQR) | 17.7% | 10.0% |
| Standard Deviation (Sample) | 18.6% | 15.6% |
| Standard Deviation (Population) | 18.5% | 15.2% |
Similar Demographics by Married-couple Households
Demographics Similar to Greeks by Married-couple Households
In terms of married-couple households, the demographic groups most similar to Greeks are Lithuanian (48.9%, a difference of 0.080%), Sri Lankan (49.0%, a difference of 0.090%), Iranian (49.0%, a difference of 0.10%), Immigrants from Bolivia (48.9%, a difference of 0.10%), and Immigrants from Lebanon (48.9%, a difference of 0.13%).
| Demographics | Rating | Rank | Married-couple Households |
| Native Hawaiians | 99.8 /100 | #31 | Exceptional 49.1% |
| Hungarians | 99.8 /100 | #32 | Exceptional 49.1% |
| Immigrants | Asia | 99.7 /100 | #33 | Exceptional 49.1% |
| Italians | 99.7 /100 | #34 | Exceptional 49.0% |
| Scottish | 99.7 /100 | #35 | Exceptional 49.0% |
| Iranians | 99.7 /100 | #36 | Exceptional 49.0% |
| Sri Lankans | 99.7 /100 | #37 | Exceptional 49.0% |
| Greeks | 99.7 /100 | #38 | Exceptional 48.9% |
| Lithuanians | 99.6 /100 | #39 | Exceptional 48.9% |
| Immigrants | Bolivia | 99.6 /100 | #40 | Exceptional 48.9% |
| Immigrants | Lebanon | 99.6 /100 | #41 | Exceptional 48.9% |
| Immigrants | Vietnam | 99.6 /100 | #42 | Exceptional 48.8% |
| Immigrants | Iran | 99.6 /100 | #43 | Exceptional 48.8% |
| Welsh | 99.5 /100 | #44 | Exceptional 48.8% |
| Immigrants | Eastern Asia | 99.5 /100 | #45 | Exceptional 48.8% |
Demographics Similar to Immigrants from Bulgaria by Married-couple Households
In terms of married-couple households, the demographic groups most similar to Immigrants from Bulgaria are Serbian (47.0%, a difference of 0.020%), Hmong (47.0%, a difference of 0.030%), Immigrants from Western Asia (46.9%, a difference of 0.040%), Arab (46.9%, a difference of 0.040%), and Immigrants from Russia (47.0%, a difference of 0.050%).
| Demographics | Rating | Rank | Married-couple Households |
| Mexicans | 83.4 /100 | #144 | Excellent 47.1% |
| Slovenes | 81.7 /100 | #145 | Excellent 47.1% |
| Immigrants | Western Europe | 81.6 /100 | #146 | Excellent 47.1% |
| Immigrants | Syria | 81.6 /100 | #147 | Excellent 47.1% |
| Icelanders | 79.5 /100 | #148 | Good 47.0% |
| Paraguayans | 78.7 /100 | #149 | Good 47.0% |
| Immigrants | Russia | 77.6 /100 | #150 | Good 47.0% |
| Immigrants | Bulgaria | 76.8 /100 | #151 | Good 47.0% |
| Serbians | 76.3 /100 | #152 | Good 47.0% |
| Hmong | 76.2 /100 | #153 | Good 47.0% |
| Immigrants | Western Asia | 76.1 /100 | #154 | Good 46.9% |
| Arabs | 76.0 /100 | #155 | Good 46.9% |
| Armenians | 75.4 /100 | #156 | Good 46.9% |
| Immigrants | Oceania | 74.8 /100 | #157 | Good 46.9% |
| Immigrants | Nonimmigrants | 73.3 /100 | #158 | Good 46.9% |