German Russian vs Paiute No Vehicles in Household
COMPARE
German Russian
Paiute
No Vehicles in Household
No Vehicles in Household Comparison
German Russians
Paiute
10.5%
NO VEHICLES IN HOUSEHOLD
40.6/ 100
METRIC RATING
186th/ 347
METRIC RANK
11.8%
NO VEHICLES IN HOUSEHOLD
1.8/ 100
METRIC RATING
250th/ 347
METRIC RANK
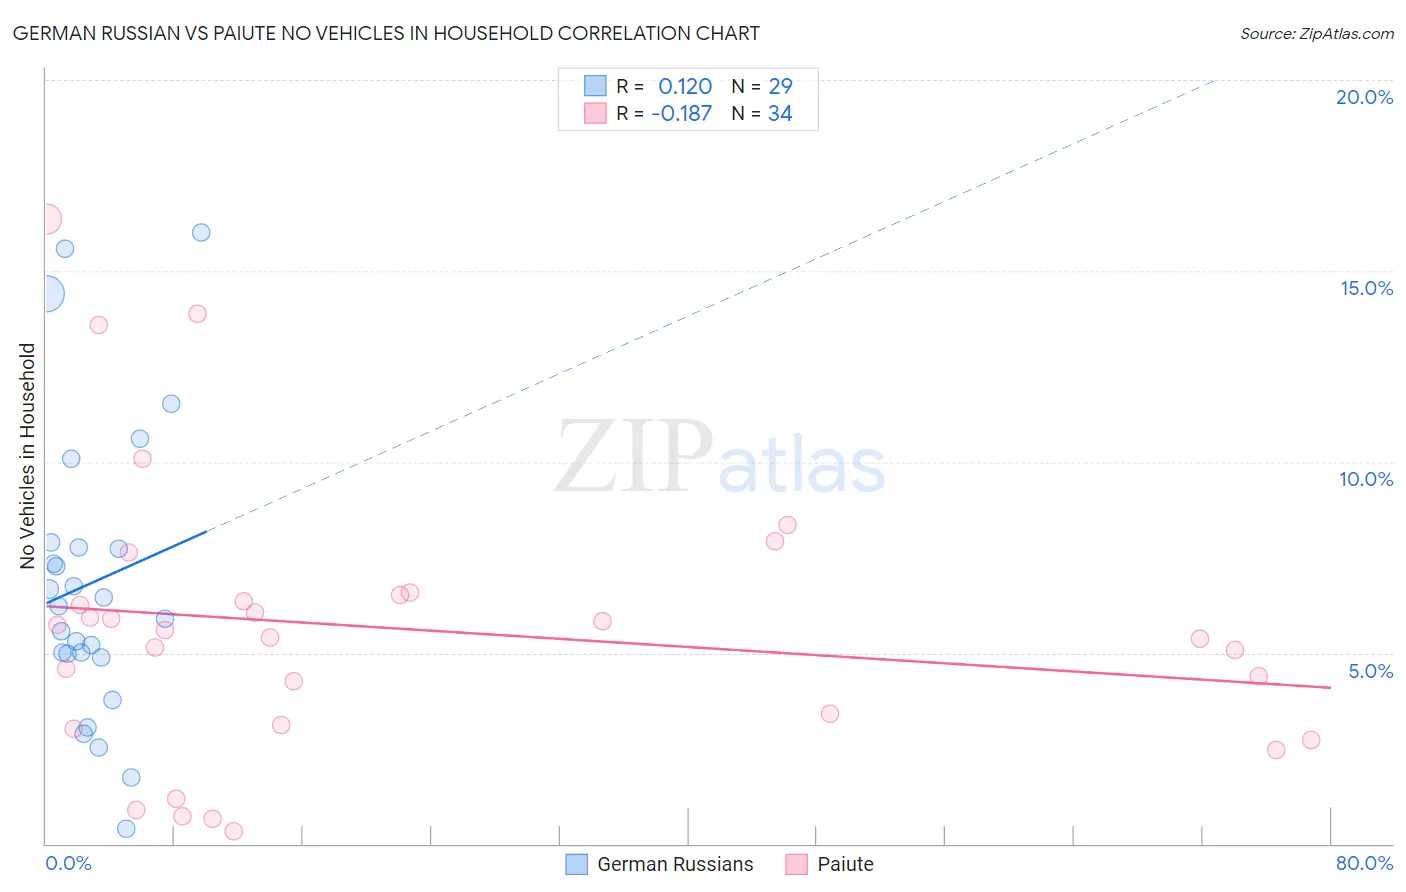
German Russian vs Paiute No Vehicles in Household Correlation Chart
The statistical analysis conducted on geographies consisting of 96,374,316 people shows a poor positive correlation between the proportion of German Russians and percentage of households with no vehicle available in the United States with a correlation coefficient (R) of 0.120 and weighted average of 10.5%. Similarly, the statistical analysis conducted on geographies consisting of 58,352,157 people shows a poor negative correlation between the proportion of Paiute and percentage of households with no vehicle available in the United States with a correlation coefficient (R) of -0.187 and weighted average of 11.8%, a difference of 12.1%.
No Vehicles in Household Correlation Summary
| Measurement | German Russian | Paiute |
| Minimum | 0.38% | 0.32% |
| Maximum | 16.0% | 16.4% |
| Range | 15.6% | 16.0% |
| Mean | 6.8% | 5.6% |
| Median | 6.2% | 5.5% |
| Interquartile 25% (IQ1) | 4.9% | 3.1% |
| Interquartile 75% (IQ3) | 7.8% | 6.5% |
| Interquartile Range (IQR) | 2.9% | 3.4% |
| Standard Deviation (Sample) | 3.9% | 3.7% |
| Standard Deviation (Population) | 3.8% | 3.6% |
Similar Demographics by No Vehicles in Household
Demographics Similar to German Russians by No Vehicles in Household
In terms of no vehicles in household, the demographic groups most similar to German Russians are South American (10.5%, a difference of 0.18%), Immigrants from Nepal (10.5%, a difference of 0.25%), Immigrants from Poland (10.6%, a difference of 0.31%), Native/Alaskan (10.5%, a difference of 0.42%), and Immigrants from Armenia (10.6%, a difference of 0.43%).
| Demographics | Rating | Rank | No Vehicles in Household |
| Ethiopians | 45.8 /100 | #179 | Average 10.5% |
| Arabs | 45.3 /100 | #180 | Average 10.5% |
| Immigrants | Colombia | 44.1 /100 | #181 | Average 10.5% |
| Immigrants | Bulgaria | 43.8 /100 | #182 | Average 10.5% |
| Natives/Alaskans | 43.7 /100 | #183 | Average 10.5% |
| Immigrants | Nepal | 42.4 /100 | #184 | Average 10.5% |
| South Americans | 41.9 /100 | #185 | Average 10.5% |
| German Russians | 40.6 /100 | #186 | Average 10.5% |
| Immigrants | Poland | 38.4 /100 | #187 | Fair 10.6% |
| Immigrants | Armenia | 37.5 /100 | #188 | Fair 10.6% |
| Immigrants | Eritrea | 36.3 /100 | #189 | Fair 10.6% |
| Immigrants | North Macedonia | 34.6 /100 | #190 | Fair 10.6% |
| Immigrants | Northern Europe | 33.1 /100 | #191 | Fair 10.7% |
| Carpatho Rusyns | 32.1 /100 | #192 | Fair 10.7% |
| Ukrainians | 28.0 /100 | #193 | Fair 10.7% |
Demographics Similar to Paiute by No Vehicles in Household
In terms of no vehicles in household, the demographic groups most similar to Paiute are Immigrants from Nigeria (11.8%, a difference of 0.22%), Immigrants from Czechoslovakia (11.8%, a difference of 0.26%), Immigrants from Belgium (11.8%, a difference of 0.26%), Menominee (11.8%, a difference of 0.32%), and Black/African American (11.9%, a difference of 0.35%).
| Demographics | Rating | Rank | No Vehicles in Household |
| Cheyenne | 2.4 /100 | #243 | Tragic 11.7% |
| Immigrants | Portugal | 2.2 /100 | #244 | Tragic 11.7% |
| Immigrants | Honduras | 2.1 /100 | #245 | Tragic 11.8% |
| Menominee | 2.0 /100 | #246 | Tragic 11.8% |
| Immigrants | Czechoslovakia | 2.0 /100 | #247 | Tragic 11.8% |
| Immigrants | Belgium | 1.9 /100 | #248 | Tragic 11.8% |
| Immigrants | Nigeria | 1.9 /100 | #249 | Tragic 11.8% |
| Paiute | 1.8 /100 | #250 | Tragic 11.8% |
| Blacks/African Americans | 1.6 /100 | #251 | Tragic 11.9% |
| Immigrants | Serbia | 1.5 /100 | #252 | Tragic 11.9% |
| Egyptians | 1.4 /100 | #253 | Tragic 11.9% |
| Immigrants | Uruguay | 1.3 /100 | #254 | Tragic 11.9% |
| Hondurans | 1.2 /100 | #255 | Tragic 12.0% |
| Liberians | 1.2 /100 | #256 | Tragic 12.0% |
| Nigerians | 0.9 /100 | #257 | Tragic 12.1% |