German Russian vs Immigrants from England No Vehicles in Household
COMPARE
German Russian
Immigrants from England
No Vehicles in Household
No Vehicles in Household Comparison
German Russians
Immigrants from England
10.5%
NO VEHICLES IN HOUSEHOLD
40.6/ 100
METRIC RATING
186th/ 347
METRIC RANK
8.7%
NO VEHICLES IN HOUSEHOLD
99.2/ 100
METRIC RATING
87th/ 347
METRIC RANK
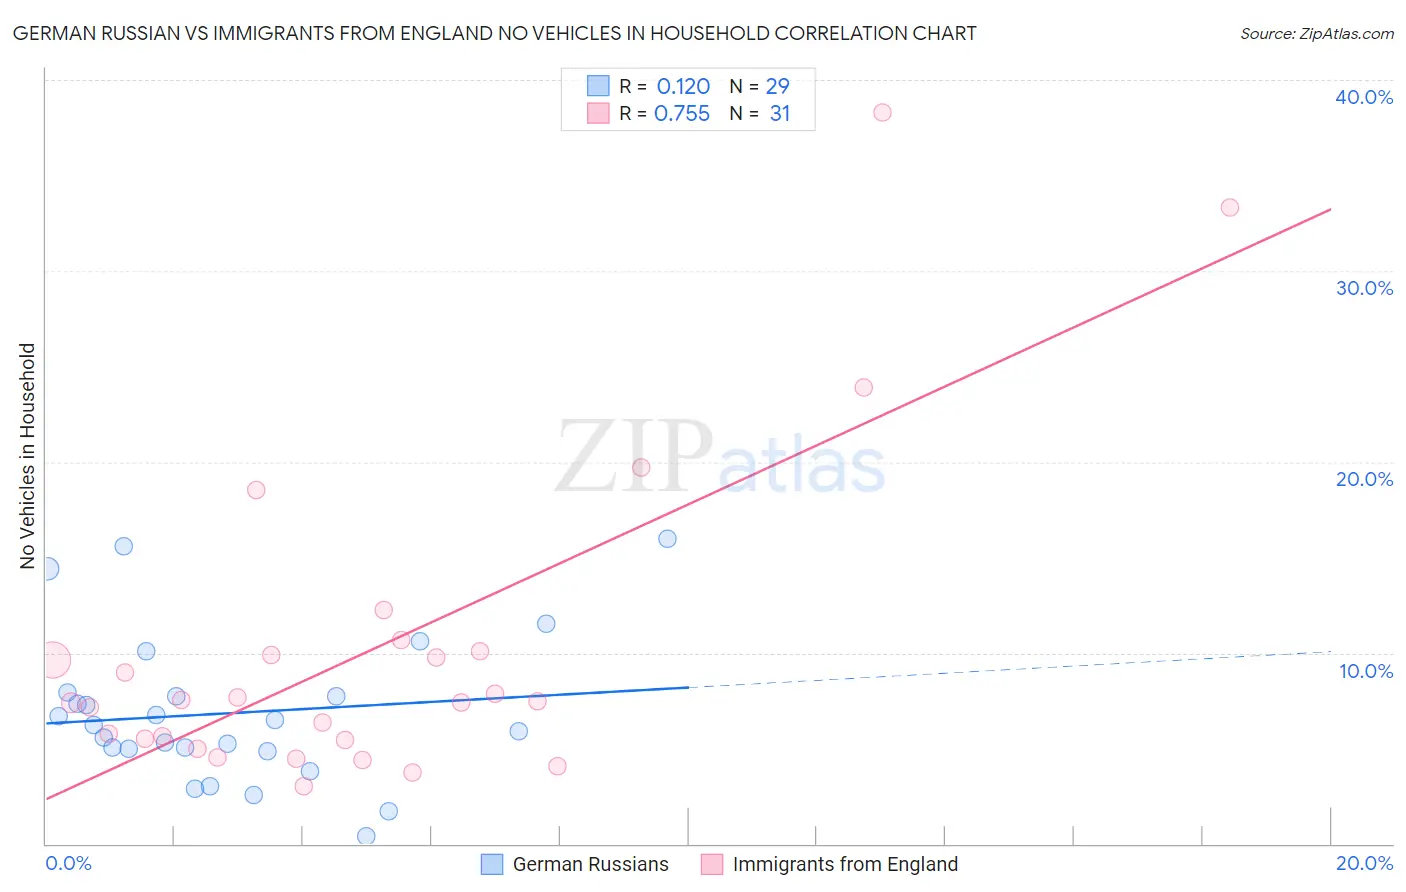
German Russian vs Immigrants from England No Vehicles in Household Correlation Chart
The statistical analysis conducted on geographies consisting of 96,374,316 people shows a poor positive correlation between the proportion of German Russians and percentage of households with no vehicle available in the United States with a correlation coefficient (R) of 0.120 and weighted average of 10.5%. Similarly, the statistical analysis conducted on geographies consisting of 390,853,276 people shows a strong positive correlation between the proportion of Immigrants from England and percentage of households with no vehicle available in the United States with a correlation coefficient (R) of 0.755 and weighted average of 8.7%, a difference of 21.4%.
No Vehicles in Household Correlation Summary
| Measurement | German Russian | Immigrants from England |
| Minimum | 0.38% | 3.0% |
| Maximum | 16.0% | 38.3% |
| Range | 15.6% | 35.3% |
| Mean | 6.8% | 10.2% |
| Median | 6.2% | 7.5% |
| Interquartile 25% (IQ1) | 4.9% | 5.4% |
| Interquartile 75% (IQ3) | 7.8% | 10.1% |
| Interquartile Range (IQR) | 2.9% | 4.6% |
| Standard Deviation (Sample) | 3.9% | 8.3% |
| Standard Deviation (Population) | 3.8% | 8.2% |
Similar Demographics by No Vehicles in Household
Demographics Similar to German Russians by No Vehicles in Household
In terms of no vehicles in household, the demographic groups most similar to German Russians are South American (10.5%, a difference of 0.18%), Immigrants from Nepal (10.5%, a difference of 0.25%), Immigrants from Poland (10.6%, a difference of 0.31%), Native/Alaskan (10.5%, a difference of 0.42%), and Immigrants from Armenia (10.6%, a difference of 0.43%).
| Demographics | Rating | Rank | No Vehicles in Household |
| Ethiopians | 45.8 /100 | #179 | Average 10.5% |
| Arabs | 45.3 /100 | #180 | Average 10.5% |
| Immigrants | Colombia | 44.1 /100 | #181 | Average 10.5% |
| Immigrants | Bulgaria | 43.8 /100 | #182 | Average 10.5% |
| Natives/Alaskans | 43.7 /100 | #183 | Average 10.5% |
| Immigrants | Nepal | 42.4 /100 | #184 | Average 10.5% |
| South Americans | 41.9 /100 | #185 | Average 10.5% |
| German Russians | 40.6 /100 | #186 | Average 10.5% |
| Immigrants | Poland | 38.4 /100 | #187 | Fair 10.6% |
| Immigrants | Armenia | 37.5 /100 | #188 | Fair 10.6% |
| Immigrants | Eritrea | 36.3 /100 | #189 | Fair 10.6% |
| Immigrants | North Macedonia | 34.6 /100 | #190 | Fair 10.6% |
| Immigrants | Northern Europe | 33.1 /100 | #191 | Fair 10.7% |
| Carpatho Rusyns | 32.1 /100 | #192 | Fair 10.7% |
| Ukrainians | 28.0 /100 | #193 | Fair 10.7% |
Demographics Similar to Immigrants from England by No Vehicles in Household
In terms of no vehicles in household, the demographic groups most similar to Immigrants from England are Osage (8.7%, a difference of 0.12%), Bangladeshi (8.7%, a difference of 0.22%), Immigrants from Cuba (8.7%, a difference of 0.26%), Lebanese (8.7%, a difference of 0.33%), and Bhutanese (8.7%, a difference of 0.35%).
| Demographics | Rating | Rank | No Vehicles in Household |
| Bolivians | 99.4 /100 | #80 | Exceptional 8.6% |
| Tsimshian | 99.4 /100 | #81 | Exceptional 8.6% |
| Immigrants | South Eastern Asia | 99.4 /100 | #82 | Exceptional 8.6% |
| Italians | 99.4 /100 | #83 | Exceptional 8.6% |
| Immigrants | Jordan | 99.3 /100 | #84 | Exceptional 8.7% |
| Lebanese | 99.3 /100 | #85 | Exceptional 8.7% |
| Bangladeshis | 99.3 /100 | #86 | Exceptional 8.7% |
| Immigrants | England | 99.2 /100 | #87 | Exceptional 8.7% |
| Osage | 99.2 /100 | #88 | Exceptional 8.7% |
| Immigrants | Cuba | 99.2 /100 | #89 | Exceptional 8.7% |
| Bhutanese | 99.2 /100 | #90 | Exceptional 8.7% |
| Immigrants | Germany | 99.1 /100 | #91 | Exceptional 8.7% |
| Immigrants | Canada | 99.1 /100 | #92 | Exceptional 8.7% |
| Immigrants | North America | 99.1 /100 | #93 | Exceptional 8.7% |
| Austrians | 98.9 /100 | #94 | Exceptional 8.8% |