German Russian vs Immigrants from Belize 1 or more Vehicles in Household
COMPARE
German Russian
Immigrants from Belize
1 or more Vehicles in Household
1 or more Vehicles in Household Comparison
German Russians
Immigrants from Belize
89.6%
1 OR MORE VEHICLES IN HOUSEHOLD
44.0/ 100
METRIC RATING
179th/ 347
METRIC RANK
84.7%
1 OR MORE VEHICLES IN HOUSEHOLD
0.0/ 100
METRIC RATING
308th/ 347
METRIC RANK
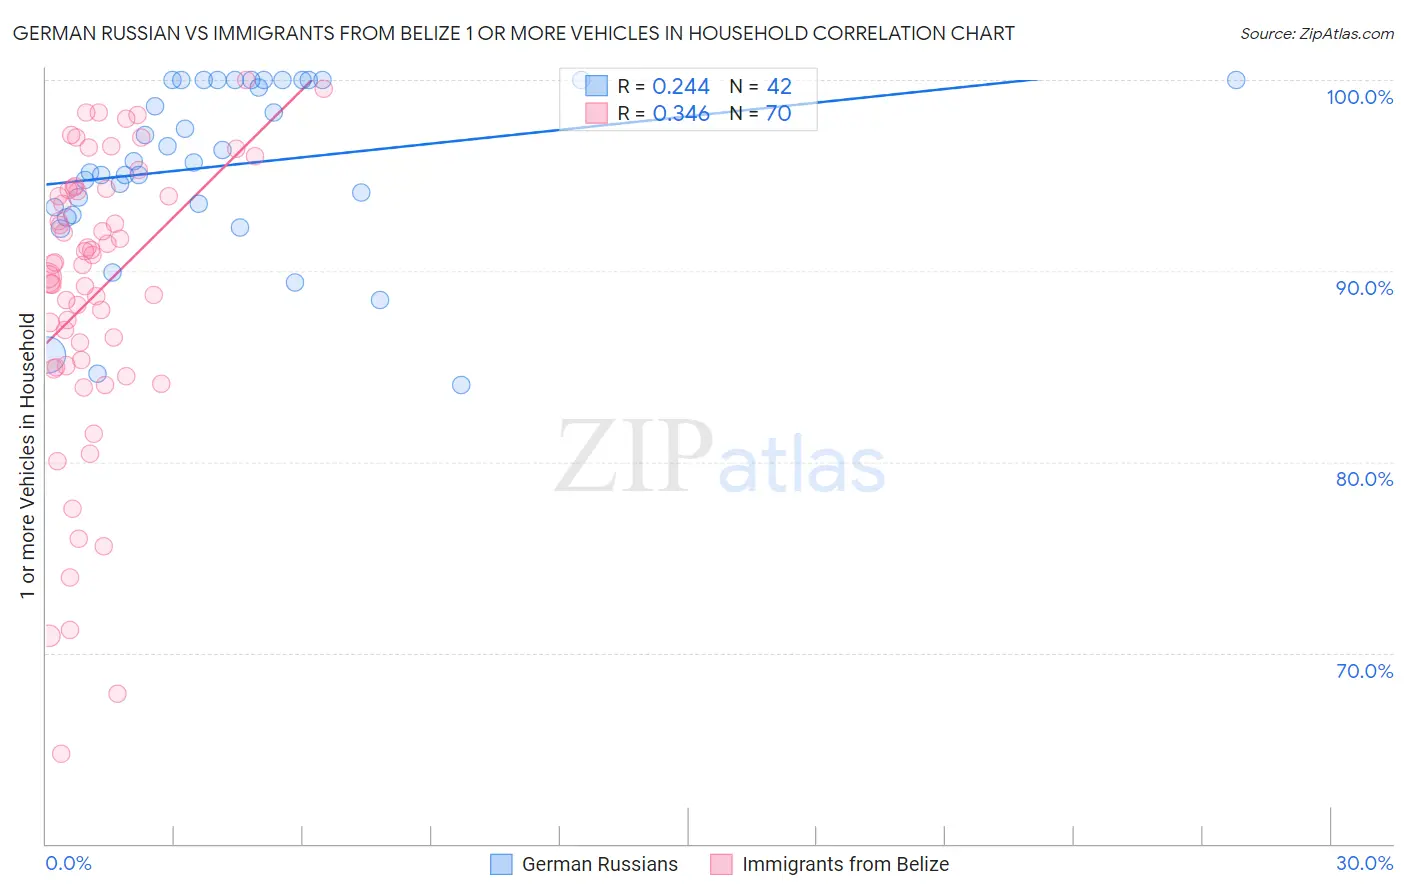
German Russian vs Immigrants from Belize 1 or more Vehicles in Household Correlation Chart
The statistical analysis conducted on geographies consisting of 96,439,918 people shows a weak positive correlation between the proportion of German Russians and percentage of households with 1 or more vehicles available in the United States with a correlation coefficient (R) of 0.244 and weighted average of 89.6%. Similarly, the statistical analysis conducted on geographies consisting of 130,296,303 people shows a mild positive correlation between the proportion of Immigrants from Belize and percentage of households with 1 or more vehicles available in the United States with a correlation coefficient (R) of 0.346 and weighted average of 84.7%, a difference of 5.8%.
1 or more Vehicles in Household Correlation Summary
| Measurement | German Russian | Immigrants from Belize |
| Minimum | 84.0% | 64.7% |
| Maximum | 100.0% | 100.0% |
| Range | 16.0% | 35.3% |
| Mean | 95.5% | 88.8% |
| Median | 95.7% | 90.3% |
| Interquartile 25% (IQ1) | 93.3% | 85.0% |
| Interquartile 75% (IQ3) | 100.0% | 94.3% |
| Interquartile Range (IQR) | 6.7% | 9.2% |
| Standard Deviation (Sample) | 4.5% | 7.7% |
| Standard Deviation (Population) | 4.4% | 7.6% |
Similar Demographics by 1 or more Vehicles in Household
Demographics Similar to German Russians by 1 or more Vehicles in Household
In terms of 1 or more vehicles in household, the demographic groups most similar to German Russians are Immigrants from El Salvador (89.6%, a difference of 0.0%), Arab (89.6%, a difference of 0.010%), Immigrants from Ethiopia (89.6%, a difference of 0.020%), Hmong (89.6%, a difference of 0.030%), and Ukrainian (89.6%, a difference of 0.030%).
| Demographics | Rating | Rank | 1 or more Vehicles in Household |
| Indonesians | 53.0 /100 | #172 | Average 89.7% |
| Lumbee | 52.8 /100 | #173 | Average 89.7% |
| Filipinos | 50.0 /100 | #174 | Average 89.7% |
| Immigrants | Burma/Myanmar | 47.6 /100 | #175 | Average 89.7% |
| Immigrants | Sudan | 47.1 /100 | #176 | Average 89.7% |
| Hmong | 45.8 /100 | #177 | Average 89.6% |
| Immigrants | El Salvador | 44.1 /100 | #178 | Average 89.6% |
| German Russians | 44.0 /100 | #179 | Average 89.6% |
| Arabs | 43.3 /100 | #180 | Average 89.6% |
| Immigrants | Ethiopia | 42.5 /100 | #181 | Average 89.6% |
| Ukrainians | 42.4 /100 | #182 | Average 89.6% |
| Ethiopians | 41.2 /100 | #183 | Average 89.6% |
| Immigrants | Bulgaria | 40.7 /100 | #184 | Average 89.6% |
| Immigrants | Brazil | 40.1 /100 | #185 | Average 89.6% |
| Pueblo | 39.9 /100 | #186 | Fair 89.6% |
Demographics Similar to Immigrants from Belize by 1 or more Vehicles in Household
In terms of 1 or more vehicles in household, the demographic groups most similar to Immigrants from Belize are Immigrants from Haiti (84.7%, a difference of 0.010%), Tohono O'odham (84.7%, a difference of 0.030%), U.S. Virgin Islander (84.6%, a difference of 0.040%), Puerto Rican (84.6%, a difference of 0.080%), and Cape Verdean (84.5%, a difference of 0.19%).
| Demographics | Rating | Rank | 1 or more Vehicles in Household |
| Immigrants | Panama | 0.0 /100 | #301 | Tragic 85.4% |
| Moroccans | 0.0 /100 | #302 | Tragic 85.4% |
| Immigrants | Greece | 0.0 /100 | #303 | Tragic 85.4% |
| Immigrants | Ukraine | 0.0 /100 | #304 | Tragic 85.2% |
| Immigrants | China | 0.0 /100 | #305 | Tragic 84.9% |
| Immigrants | Western Africa | 0.0 /100 | #306 | Tragic 84.9% |
| Tohono O'odham | 0.0 /100 | #307 | Tragic 84.7% |
| Immigrants | Belize | 0.0 /100 | #308 | Tragic 84.7% |
| Immigrants | Haiti | 0.0 /100 | #309 | Tragic 84.7% |
| U.S. Virgin Islanders | 0.0 /100 | #310 | Tragic 84.6% |
| Puerto Ricans | 0.0 /100 | #311 | Tragic 84.6% |
| Cape Verdeans | 0.0 /100 | #312 | Tragic 84.5% |
| Immigrants | Israel | 0.0 /100 | #313 | Tragic 84.5% |
| Albanians | 0.0 /100 | #314 | Tragic 84.4% |
| Cypriots | 0.0 /100 | #315 | Tragic 84.4% |