Finnish vs Immigrants from Colombia Disability
COMPARE
Finnish
Immigrants from Colombia
Disability
Disability Comparison
Finns
Immigrants from Colombia
12.7%
DISABILITY
0.0/ 100
METRIC RATING
273rd/ 347
METRIC RANK
10.9%
DISABILITY
99.7/ 100
METRIC RATING
59th/ 347
METRIC RANK
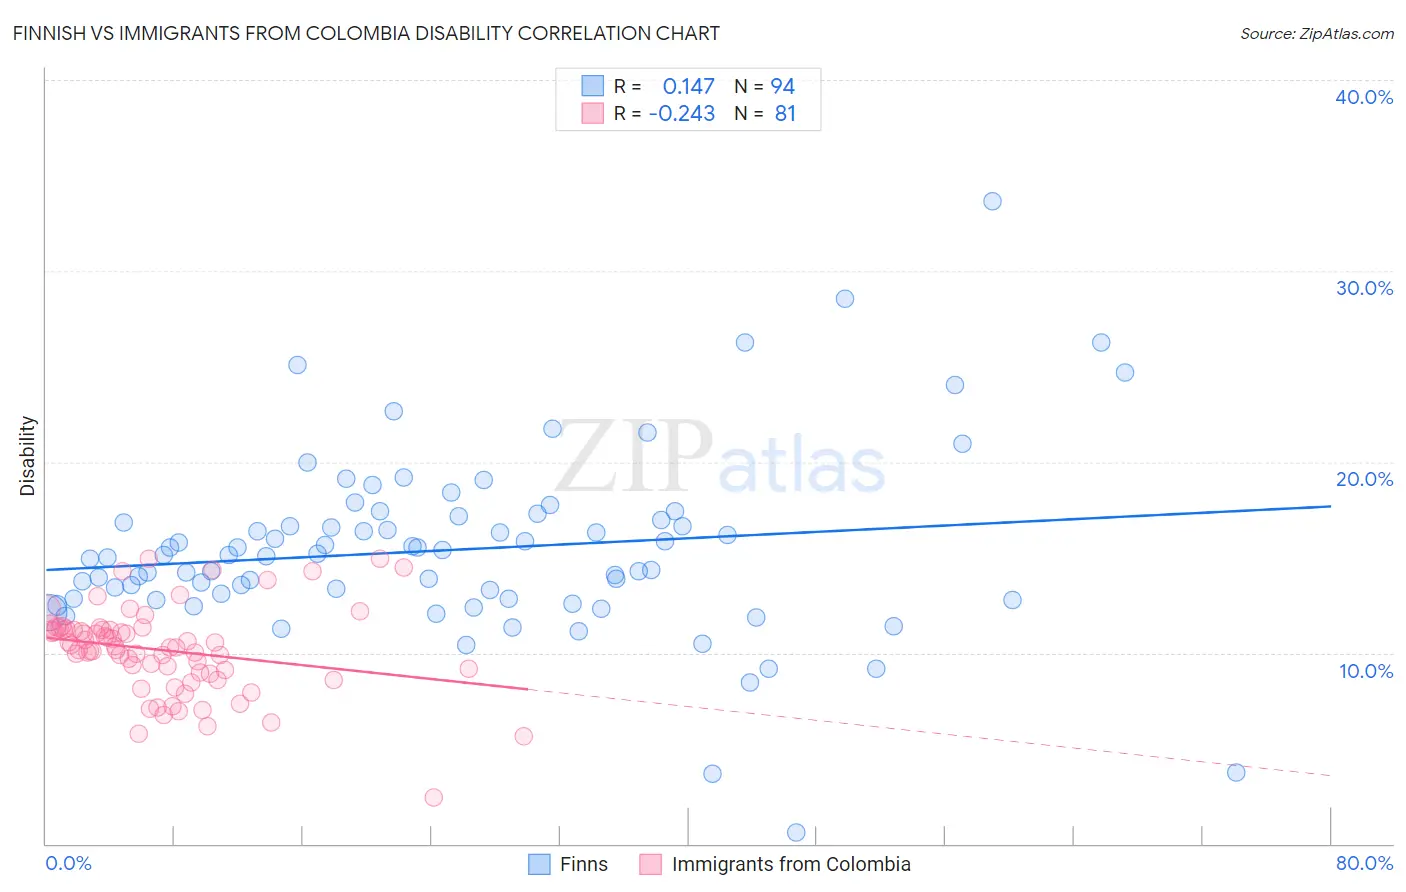
Finnish vs Immigrants from Colombia Disability Correlation Chart
The statistical analysis conducted on geographies consisting of 404,645,748 people shows a poor positive correlation between the proportion of Finns and percentage of population with a disability in the United States with a correlation coefficient (R) of 0.147 and weighted average of 12.7%. Similarly, the statistical analysis conducted on geographies consisting of 378,650,675 people shows a weak negative correlation between the proportion of Immigrants from Colombia and percentage of population with a disability in the United States with a correlation coefficient (R) of -0.243 and weighted average of 10.9%, a difference of 16.3%.
Disability Correlation Summary
| Measurement | Finnish | Immigrants from Colombia |
| Minimum | 0.58% | 2.4% |
| Maximum | 33.6% | 14.9% |
| Range | 33.1% | 12.5% |
| Mean | 15.4% | 10.1% |
| Median | 15.1% | 10.3% |
| Interquartile 25% (IQ1) | 12.8% | 8.9% |
| Interquartile 75% (IQ3) | 17.0% | 11.2% |
| Interquartile Range (IQR) | 4.2% | 2.3% |
| Standard Deviation (Sample) | 4.8% | 2.3% |
| Standard Deviation (Population) | 4.8% | 2.3% |
Similar Demographics by Disability
Demographics Similar to Finns by Disability
In terms of disability, the demographic groups most similar to Finns are Dominican (12.7%, a difference of 0.16%), Nepalese (12.8%, a difference of 0.43%), Sioux (12.8%, a difference of 0.51%), Immigrants from Yemen (12.6%, a difference of 0.66%), and Hmong (12.8%, a difference of 0.67%).
| Demographics | Rating | Rank | Disability |
| Czechoslovakians | 0.2 /100 | #266 | Tragic 12.5% |
| Spaniards | 0.2 /100 | #267 | Tragic 12.5% |
| Bangladeshis | 0.1 /100 | #268 | Tragic 12.6% |
| Immigrants | Dominican Republic | 0.1 /100 | #269 | Tragic 12.6% |
| Portuguese | 0.1 /100 | #270 | Tragic 12.6% |
| Immigrants | Yemen | 0.1 /100 | #271 | Tragic 12.6% |
| Dominicans | 0.0 /100 | #272 | Tragic 12.7% |
| Finns | 0.0 /100 | #273 | Tragic 12.7% |
| Nepalese | 0.0 /100 | #274 | Tragic 12.8% |
| Sioux | 0.0 /100 | #275 | Tragic 12.8% |
| Hmong | 0.0 /100 | #276 | Tragic 12.8% |
| Dutch | 0.0 /100 | #277 | Tragic 12.8% |
| Germans | 0.0 /100 | #278 | Tragic 12.8% |
| Fijians | 0.0 /100 | #279 | Tragic 12.8% |
| Spanish | 0.0 /100 | #280 | Tragic 12.8% |
Demographics Similar to Immigrants from Colombia by Disability
In terms of disability, the demographic groups most similar to Immigrants from Colombia are Immigrants from South America (10.9%, a difference of 0.090%), Zimbabwean (10.9%, a difference of 0.090%), Salvadoran (10.9%, a difference of 0.12%), Immigrants from Bulgaria (10.9%, a difference of 0.15%), and Immigrants from Northern Africa (10.9%, a difference of 0.19%).
| Demographics | Rating | Rank | Disability |
| South Americans | 99.8 /100 | #52 | Exceptional 10.9% |
| Immigrants | Spain | 99.8 /100 | #53 | Exceptional 10.9% |
| Jordanians | 99.8 /100 | #54 | Exceptional 10.9% |
| Immigrants | El Salvador | 99.8 /100 | #55 | Exceptional 10.9% |
| Immigrants | Lithuania | 99.8 /100 | #56 | Exceptional 10.9% |
| Salvadorans | 99.8 /100 | #57 | Exceptional 10.9% |
| Immigrants | South America | 99.8 /100 | #58 | Exceptional 10.9% |
| Immigrants | Colombia | 99.7 /100 | #59 | Exceptional 10.9% |
| Zimbabweans | 99.7 /100 | #60 | Exceptional 10.9% |
| Immigrants | Bulgaria | 99.7 /100 | #61 | Exceptional 10.9% |
| Immigrants | Northern Africa | 99.7 /100 | #62 | Exceptional 10.9% |
| Immigrants | Eritrea | 99.7 /100 | #63 | Exceptional 11.0% |
| Immigrants | Sweden | 99.6 /100 | #64 | Exceptional 11.0% |
| Bulgarians | 99.6 /100 | #65 | Exceptional 11.0% |
| Laotians | 99.6 /100 | #66 | Exceptional 11.0% |