Fijian vs Houma 9th Grade
COMPARE
Fijian
Houma
9th Grade
9th Grade Comparison
Fijians
Houma
93.1%
9TH GRADE
0.0/ 100
METRIC RATING
297th/ 347
METRIC RANK
92.3%
9TH GRADE
0.0/ 100
METRIC RATING
312th/ 347
METRIC RANK
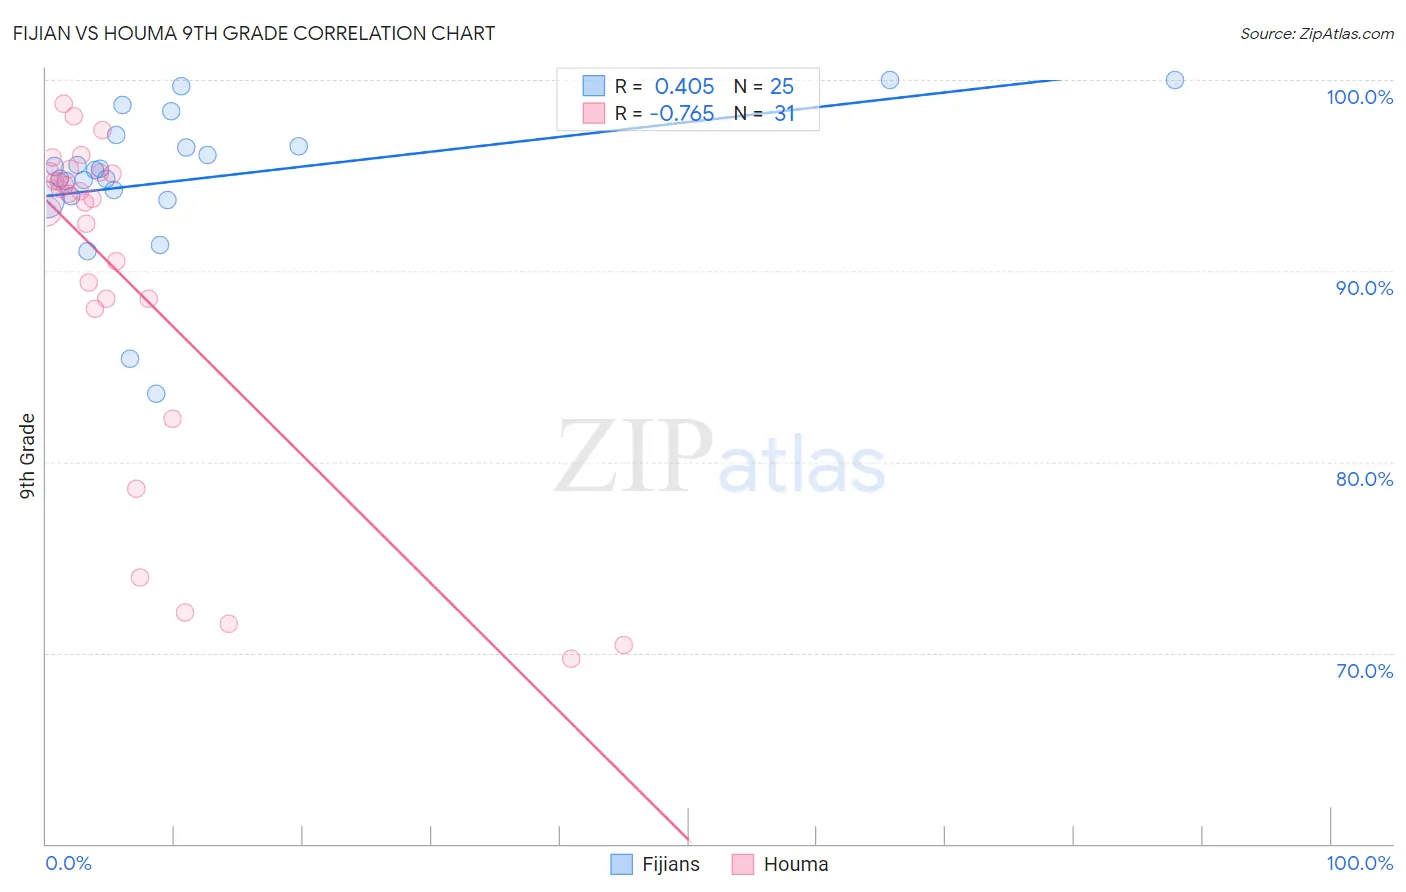
Fijian vs Houma 9th Grade Correlation Chart
The statistical analysis conducted on geographies consisting of 55,948,842 people shows a moderate positive correlation between the proportion of Fijians and percentage of population with at least 9th grade education in the United States with a correlation coefficient (R) of 0.405 and weighted average of 93.1%. Similarly, the statistical analysis conducted on geographies consisting of 36,795,916 people shows a strong negative correlation between the proportion of Houma and percentage of population with at least 9th grade education in the United States with a correlation coefficient (R) of -0.765 and weighted average of 92.3%, a difference of 0.89%.
9th Grade Correlation Summary
| Measurement | Fijian | Houma |
| Minimum | 83.6% | 69.7% |
| Maximum | 100.0% | 98.8% |
| Range | 16.4% | 29.0% |
| Mean | 94.8% | 89.4% |
| Median | 95.3% | 93.8% |
| Interquartile 25% (IQ1) | 93.8% | 88.0% |
| Interquartile 75% (IQ3) | 96.8% | 95.1% |
| Interquartile Range (IQR) | 3.0% | 7.1% |
| Standard Deviation (Sample) | 3.9% | 9.0% |
| Standard Deviation (Population) | 3.8% | 8.9% |
Demographics Similar to Fijians and Houma by 9th Grade
In terms of 9th grade, the demographic groups most similar to Fijians are Immigrants from Burma/Myanmar (93.1%, a difference of 0.030%), Indonesian (93.1%, a difference of 0.030%), Haitian (93.1%, a difference of 0.030%), Cuban (93.2%, a difference of 0.050%), and Immigrants from Grenada (93.0%, a difference of 0.090%). Similarly, the demographic groups most similar to Houma are Vietnamese (92.3%, a difference of 0.020%), Immigrants from Fiji (92.3%, a difference of 0.030%), Immigrants from Cambodia (92.4%, a difference of 0.060%), Immigrants from Portugal (92.2%, a difference of 0.060%), and Immigrants from Bangladesh (92.4%, a difference of 0.080%).
| Demographics | Rating | Rank | 9th Grade |
| Cubans | 0.0 /100 | #294 | Tragic 93.2% |
| Immigrants | Burma/Myanmar | 0.0 /100 | #295 | Tragic 93.1% |
| Indonesians | 0.0 /100 | #296 | Tragic 93.1% |
| Fijians | 0.0 /100 | #297 | Tragic 93.1% |
| Haitians | 0.0 /100 | #298 | Tragic 93.1% |
| Immigrants | Grenada | 0.0 /100 | #299 | Tragic 93.0% |
| Yaqui | 0.0 /100 | #300 | Tragic 92.9% |
| Immigrants | Haiti | 0.0 /100 | #301 | Tragic 92.7% |
| Immigrants | Dominica | 0.0 /100 | #302 | Tragic 92.7% |
| Guyanese | 0.0 /100 | #303 | Tragic 92.7% |
| Tohono O'odham | 0.0 /100 | #304 | Tragic 92.6% |
| Japanese | 0.0 /100 | #305 | Tragic 92.6% |
| Immigrants | Vietnam | 0.0 /100 | #306 | Tragic 92.6% |
| Immigrants | Immigrants | 0.0 /100 | #307 | Tragic 92.5% |
| Immigrants | Guyana | 0.0 /100 | #308 | Tragic 92.5% |
| Immigrants | Bangladesh | 0.0 /100 | #309 | Tragic 92.4% |
| Immigrants | Cambodia | 0.0 /100 | #310 | Tragic 92.4% |
| Immigrants | Fiji | 0.0 /100 | #311 | Tragic 92.3% |
| Houma | 0.0 /100 | #312 | Tragic 92.3% |
| Vietnamese | 0.0 /100 | #313 | Tragic 92.3% |
| Immigrants | Portugal | 0.0 /100 | #314 | Tragic 92.2% |