Fijian vs Central American Indian 3 or more Vehicles in Household
COMPARE
Fijian
Central American Indian
3 or more Vehicles in Household
3 or more Vehicles in Household Comparison
Fijians
Central American Indians
22.2%
3 OR MORE VEHICLES IN HOUSEHOLD
99.9/ 100
METRIC RATING
62nd/ 347
METRIC RANK
19.0%
3 OR MORE VEHICLES IN HOUSEHOLD
22.2/ 100
METRIC RATING
196th/ 347
METRIC RANK
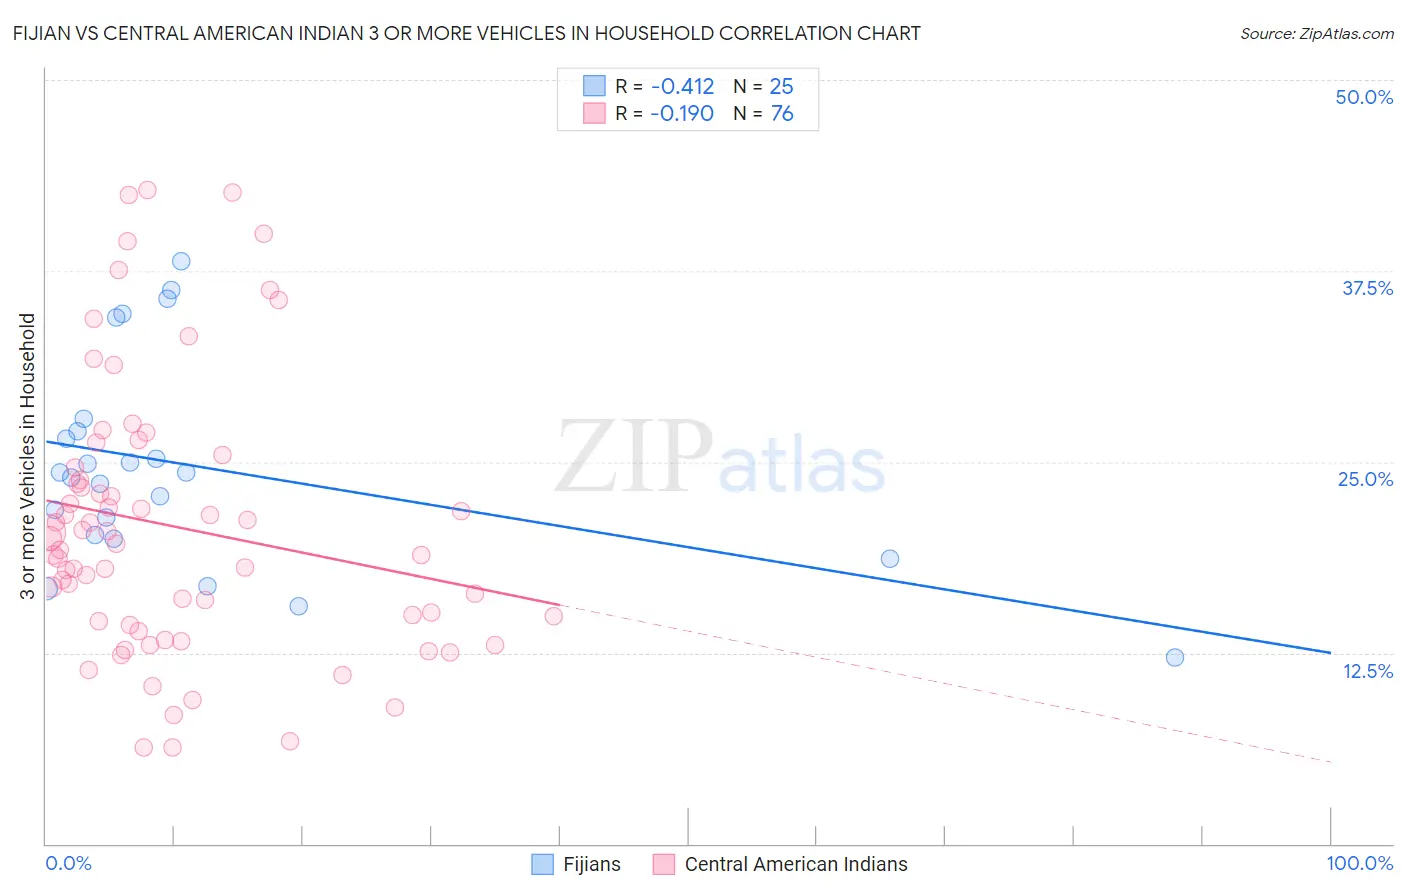
Fijian vs Central American Indian 3 or more Vehicles in Household Correlation Chart
The statistical analysis conducted on geographies consisting of 55,946,272 people shows a moderate negative correlation between the proportion of Fijians and percentage of households with 3 or more vehicles available in the United States with a correlation coefficient (R) of -0.412 and weighted average of 22.2%. Similarly, the statistical analysis conducted on geographies consisting of 326,022,544 people shows a poor negative correlation between the proportion of Central American Indians and percentage of households with 3 or more vehicles available in the United States with a correlation coefficient (R) of -0.190 and weighted average of 19.0%, a difference of 16.8%.
3 or more Vehicles in Household Correlation Summary
| Measurement | Fijian | Central American Indian |
| Minimum | 12.2% | 6.3% |
| Maximum | 38.1% | 42.8% |
| Range | 26.0% | 36.6% |
| Mean | 24.7% | 20.8% |
| Median | 24.3% | 19.4% |
| Interquartile 25% (IQ1) | 20.1% | 14.4% |
| Interquartile 75% (IQ3) | 27.4% | 24.2% |
| Interquartile Range (IQR) | 7.3% | 9.8% |
| Standard Deviation (Sample) | 6.8% | 8.9% |
| Standard Deviation (Population) | 6.7% | 8.8% |
Similar Demographics by 3 or more Vehicles in Household
Demographics Similar to Fijians by 3 or more Vehicles in Household
In terms of 3 or more vehicles in household, the demographic groups most similar to Fijians are Bhutanese (22.2%, a difference of 0.040%), Chickasaw (22.2%, a difference of 0.16%), Finnish (22.3%, a difference of 0.20%), Navajo (22.3%, a difference of 0.28%), and Spaniard (22.3%, a difference of 0.35%).
| Demographics | Rating | Rank | 3 or more Vehicles in Household |
| Immigrants | Laos | 100.0 /100 | #55 | Exceptional 22.4% |
| Hispanics or Latinos | 100.0 /100 | #56 | Exceptional 22.4% |
| Pennsylvania Germans | 100.0 /100 | #57 | Exceptional 22.3% |
| Spaniards | 100.0 /100 | #58 | Exceptional 22.3% |
| Navajo | 100.0 /100 | #59 | Exceptional 22.3% |
| Finns | 99.9 /100 | #60 | Exceptional 22.3% |
| Bhutanese | 99.9 /100 | #61 | Exceptional 22.2% |
| Fijians | 99.9 /100 | #62 | Exceptional 22.2% |
| Chickasaw | 99.9 /100 | #63 | Exceptional 22.2% |
| Immigrants | Taiwan | 99.9 /100 | #64 | Exceptional 22.1% |
| Pima | 99.9 /100 | #65 | Exceptional 22.0% |
| Northern Europeans | 99.9 /100 | #66 | Exceptional 22.0% |
| Alaskan Athabascans | 99.9 /100 | #67 | Exceptional 21.9% |
| British | 99.9 /100 | #68 | Exceptional 21.9% |
| Creek | 99.9 /100 | #69 | Exceptional 21.9% |
Demographics Similar to Central American Indians by 3 or more Vehicles in Household
In terms of 3 or more vehicles in household, the demographic groups most similar to Central American Indians are Immigrants from Japan (19.0%, a difference of 0.030%), Immigrants from Moldova (19.1%, a difference of 0.15%), Serbian (19.1%, a difference of 0.19%), Tsimshian (19.1%, a difference of 0.23%), and Kenyan (19.1%, a difference of 0.27%).
| Demographics | Rating | Rank | 3 or more Vehicles in Household |
| Indians (Asian) | 26.0 /100 | #189 | Fair 19.1% |
| Immigrants | Zimbabwe | 25.5 /100 | #190 | Fair 19.1% |
| South American Indians | 25.4 /100 | #191 | Fair 19.1% |
| Kenyans | 24.7 /100 | #192 | Fair 19.1% |
| Tsimshian | 24.4 /100 | #193 | Fair 19.1% |
| Serbians | 24.0 /100 | #194 | Fair 19.1% |
| Immigrants | Moldova | 23.6 /100 | #195 | Fair 19.1% |
| Central American Indians | 22.2 /100 | #196 | Fair 19.0% |
| Immigrants | Japan | 22.0 /100 | #197 | Fair 19.0% |
| Egyptians | 19.5 /100 | #198 | Poor 19.0% |
| Immigrants | Norway | 19.0 /100 | #199 | Poor 19.0% |
| Argentineans | 18.2 /100 | #200 | Poor 18.9% |
| Arabs | 17.7 /100 | #201 | Poor 18.9% |
| Immigrants | Austria | 15.4 /100 | #202 | Poor 18.9% |
| Tohono O'odham | 14.8 /100 | #203 | Poor 18.9% |