European vs Immigrants High School Diploma
COMPARE
European
Immigrants
High School Diploma
High School Diploma Comparison
Europeans
Immigrants
91.4%
HIGH SCHOOL DIPLOMA
99.9/ 100
METRIC RATING
29th/ 347
METRIC RANK
85.8%
HIGH SCHOOL DIPLOMA
0.0/ 100
METRIC RATING
295th/ 347
METRIC RANK
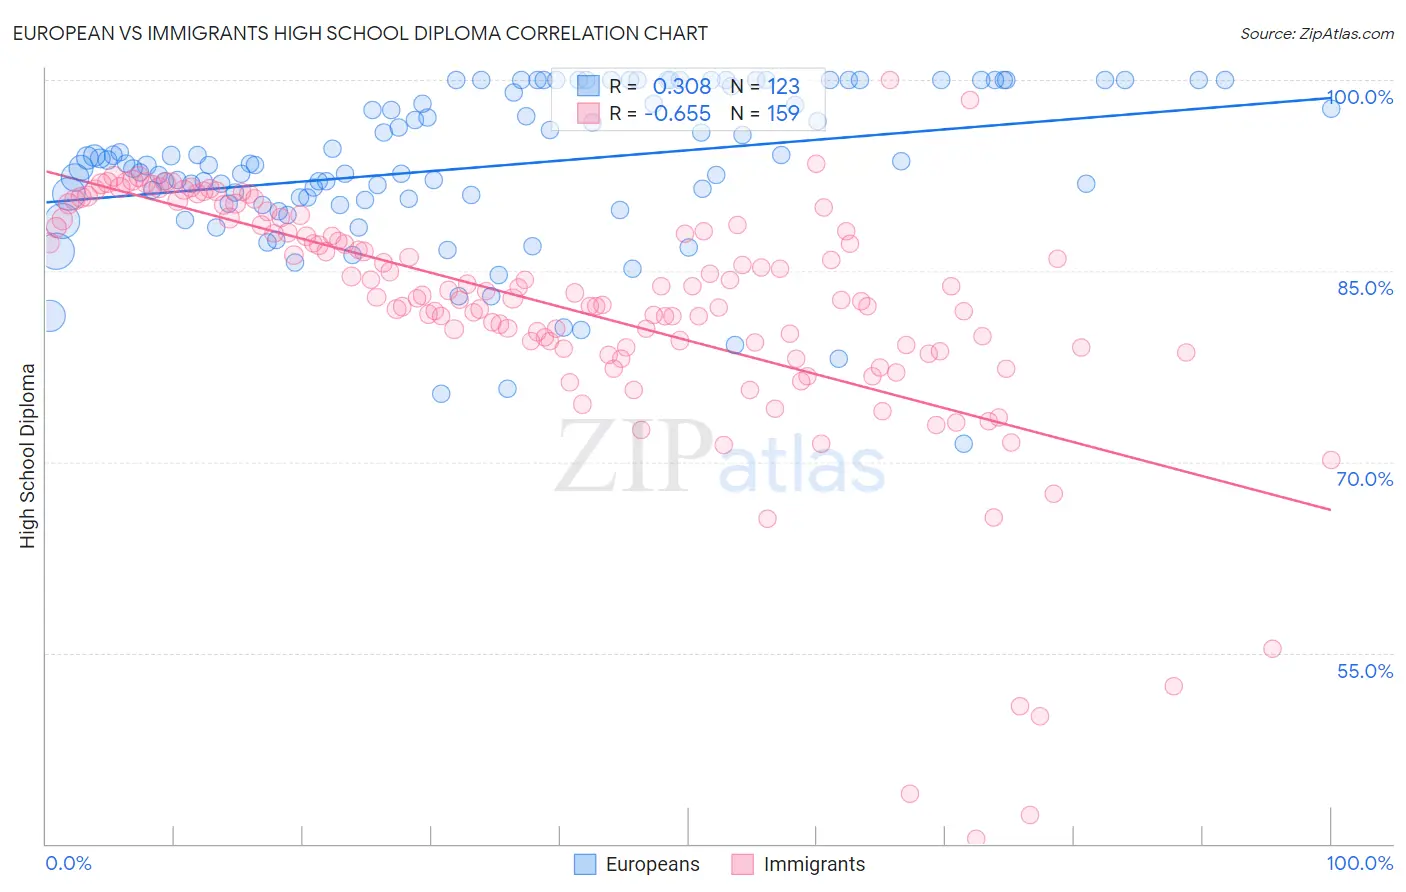
European vs Immigrants High School Diploma Correlation Chart
The statistical analysis conducted on geographies consisting of 561,829,322 people shows a mild positive correlation between the proportion of Europeans and percentage of population with at least high school diploma education in the United States with a correlation coefficient (R) of 0.308 and weighted average of 91.4%. Similarly, the statistical analysis conducted on geographies consisting of 577,785,048 people shows a significant negative correlation between the proportion of Immigrants and percentage of population with at least high school diploma education in the United States with a correlation coefficient (R) of -0.655 and weighted average of 85.8%, a difference of 6.5%.
High School Diploma Correlation Summary
| Measurement | European | Immigrants |
| Minimum | 71.4% | 40.4% |
| Maximum | 100.0% | 100.0% |
| Range | 28.6% | 59.6% |
| Mean | 93.2% | 82.1% |
| Median | 93.3% | 83.1% |
| Interquartile 25% (IQ1) | 90.6% | 79.0% |
| Interquartile 75% (IQ3) | 99.5% | 88.6% |
| Interquartile Range (IQR) | 8.9% | 9.6% |
| Standard Deviation (Sample) | 6.1% | 9.7% |
| Standard Deviation (Population) | 6.1% | 9.7% |
Similar Demographics by High School Diploma
Demographics Similar to Europeans by High School Diploma
In terms of high school diploma, the demographic groups most similar to Europeans are Iranian (91.4%, a difference of 0.010%), Immigrants from Northern Europe (91.4%, a difference of 0.010%), Tlingit-Haida (91.4%, a difference of 0.020%), English (91.4%, a difference of 0.020%), and Okinawan (91.4%, a difference of 0.020%).
| Demographics | Rating | Rank | High School Diploma |
| Estonians | 99.9 /100 | #22 | Exceptional 91.6% |
| Scandinavians | 99.9 /100 | #23 | Exceptional 91.5% |
| Italians | 99.9 /100 | #24 | Exceptional 91.5% |
| Thais | 99.9 /100 | #25 | Exceptional 91.5% |
| Russians | 99.9 /100 | #26 | Exceptional 91.5% |
| Cypriots | 99.9 /100 | #27 | Exceptional 91.5% |
| Tlingit-Haida | 99.9 /100 | #28 | Exceptional 91.4% |
| Europeans | 99.9 /100 | #29 | Exceptional 91.4% |
| Iranians | 99.9 /100 | #30 | Exceptional 91.4% |
| Immigrants | Northern Europe | 99.9 /100 | #31 | Exceptional 91.4% |
| English | 99.9 /100 | #32 | Exceptional 91.4% |
| Okinawans | 99.9 /100 | #33 | Exceptional 91.4% |
| Scottish | 99.9 /100 | #34 | Exceptional 91.4% |
| Irish | 99.9 /100 | #35 | Exceptional 91.4% |
| Tsimshian | 99.9 /100 | #36 | Exceptional 91.3% |
Demographics Similar to Immigrants by High School Diploma
In terms of high school diploma, the demographic groups most similar to Immigrants are Immigrants from Fiji (85.8%, a difference of 0.020%), British West Indian (85.9%, a difference of 0.050%), Japanese (85.9%, a difference of 0.070%), Haitian (85.9%, a difference of 0.080%), and Fijian (86.0%, a difference of 0.21%).
| Demographics | Rating | Rank | High School Diploma |
| Immigrants | Vietnam | 0.0 /100 | #288 | Tragic 86.2% |
| Yup'ik | 0.0 /100 | #289 | Tragic 86.1% |
| Fijians | 0.0 /100 | #290 | Tragic 86.0% |
| Haitians | 0.0 /100 | #291 | Tragic 85.9% |
| Japanese | 0.0 /100 | #292 | Tragic 85.9% |
| British West Indians | 0.0 /100 | #293 | Tragic 85.9% |
| Immigrants | Fiji | 0.0 /100 | #294 | Tragic 85.8% |
| Immigrants | Immigrants | 0.0 /100 | #295 | Tragic 85.8% |
| Immigrants | Cambodia | 0.0 /100 | #296 | Tragic 85.6% |
| Immigrants | Grenada | 0.0 /100 | #297 | Tragic 85.6% |
| Natives/Alaskans | 0.0 /100 | #298 | Tragic 85.6% |
| Guyanese | 0.0 /100 | #299 | Tragic 85.5% |
| Immigrants | Bangladesh | 0.0 /100 | #300 | Tragic 85.5% |
| Vietnamese | 0.0 /100 | #301 | Tragic 85.4% |
| Immigrants | Haiti | 0.0 /100 | #302 | Tragic 85.4% |