Czech vs Pennsylvania German Female Poverty Among 18-24 Year Olds
COMPARE
Czech
Pennsylvania German
Female Poverty Among 18-24 Year Olds
Female Poverty Among 18-24 Year Olds Comparison
Czechs
Pennsylvania Germans
20.4%
FEMALE POVERTY AMONG 18-24 YEAR OLDS
22.3/ 100
METRIC RATING
196th/ 347
METRIC RANK
19.7%
FEMALE POVERTY AMONG 18-24 YEAR OLDS
85.5/ 100
METRIC RATING
141st/ 347
METRIC RANK
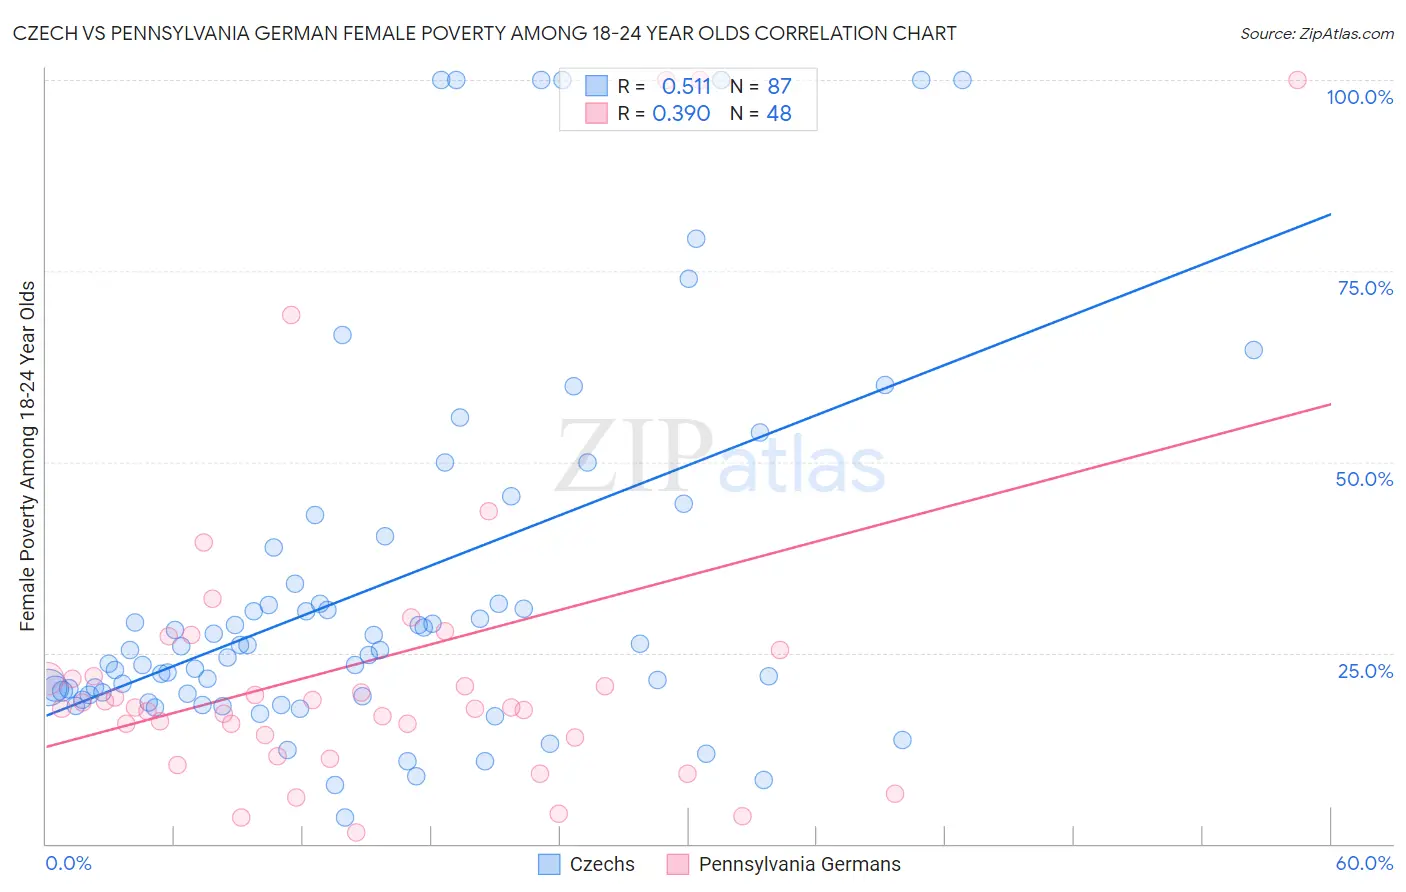
Czech vs Pennsylvania German Female Poverty Among 18-24 Year Olds Correlation Chart
The statistical analysis conducted on geographies consisting of 464,095,157 people shows a substantial positive correlation between the proportion of Czechs and poverty level among females between the ages 18 and 24 in the United States with a correlation coefficient (R) of 0.511 and weighted average of 20.4%. Similarly, the statistical analysis conducted on geographies consisting of 228,021,378 people shows a mild positive correlation between the proportion of Pennsylvania Germans and poverty level among females between the ages 18 and 24 in the United States with a correlation coefficient (R) of 0.390 and weighted average of 19.7%, a difference of 3.8%.
Female Poverty Among 18-24 Year Olds Correlation Summary
| Measurement | Czech | Pennsylvania German |
| Minimum | 3.4% | 1.4% |
| Maximum | 100.0% | 100.0% |
| Range | 96.6% | 98.6% |
| Mean | 33.8% | 23.9% |
| Median | 25.4% | 17.8% |
| Interquartile 25% (IQ1) | 19.5% | 14.0% |
| Interquartile 75% (IQ3) | 38.8% | 23.7% |
| Interquartile Range (IQR) | 19.3% | 9.6% |
| Standard Deviation (Sample) | 24.6% | 22.8% |
| Standard Deviation (Population) | 24.4% | 22.6% |
Similar Demographics by Female Poverty Among 18-24 Year Olds
Demographics Similar to Czechs by Female Poverty Among 18-24 Year Olds
In terms of female poverty among 18-24 year olds, the demographic groups most similar to Czechs are Immigrants from Latvia (20.4%, a difference of 0.050%), Mexican American Indian (20.4%, a difference of 0.060%), Nigerian (20.4%, a difference of 0.070%), Zimbabwean (20.4%, a difference of 0.090%), and Immigrants from Spain (20.4%, a difference of 0.12%).
| Demographics | Rating | Rank | Female Poverty Among 18-24 Year Olds |
| Immigrants | Germany | 34.0 /100 | #189 | Fair 20.3% |
| Immigrants | Western Asia | 29.3 /100 | #190 | Fair 20.3% |
| Moroccans | 25.8 /100 | #191 | Fair 20.4% |
| Immigrants | Israel | 24.4 /100 | #192 | Fair 20.4% |
| Nigerians | 23.4 /100 | #193 | Fair 20.4% |
| Mexican American Indians | 23.2 /100 | #194 | Fair 20.4% |
| Immigrants | Latvia | 23.0 /100 | #195 | Fair 20.4% |
| Czechs | 22.3 /100 | #196 | Fair 20.4% |
| Zimbabweans | 21.0 /100 | #197 | Fair 20.4% |
| Immigrants | Spain | 20.7 /100 | #198 | Fair 20.4% |
| Germans | 20.6 /100 | #199 | Fair 20.4% |
| Europeans | 19.9 /100 | #200 | Poor 20.4% |
| Mexicans | 18.3 /100 | #201 | Poor 20.5% |
| Immigrants | Turkey | 17.7 /100 | #202 | Poor 20.5% |
| Immigrants | Malaysia | 17.2 /100 | #203 | Poor 20.5% |
Demographics Similar to Pennsylvania Germans by Female Poverty Among 18-24 Year Olds
In terms of female poverty among 18-24 year olds, the demographic groups most similar to Pennsylvania Germans are Immigrants from Trinidad and Tobago (19.7%, a difference of 0.010%), Panamanian (19.7%, a difference of 0.090%), Slavic (19.7%, a difference of 0.11%), Immigrants from Northern Africa (19.7%, a difference of 0.14%), and Canadian (19.7%, a difference of 0.17%).
| Demographics | Rating | Rank | Female Poverty Among 18-24 Year Olds |
| Immigrants | North America | 92.1 /100 | #134 | Exceptional 19.5% |
| Soviet Union | 92.0 /100 | #135 | Exceptional 19.5% |
| Russians | 91.5 /100 | #136 | Exceptional 19.5% |
| Austrians | 90.7 /100 | #137 | Exceptional 19.5% |
| Immigrants | Morocco | 89.9 /100 | #138 | Excellent 19.6% |
| Indians (Asian) | 88.3 /100 | #139 | Excellent 19.6% |
| Immigrants | Trinidad and Tobago | 85.6 /100 | #140 | Excellent 19.7% |
| Pennsylvania Germans | 85.5 /100 | #141 | Excellent 19.7% |
| Panamanians | 84.6 /100 | #142 | Excellent 19.7% |
| Slavs | 84.4 /100 | #143 | Excellent 19.7% |
| Immigrants | Northern Africa | 84.1 /100 | #144 | Excellent 19.7% |
| Canadians | 83.8 /100 | #145 | Excellent 19.7% |
| Immigrants | Bosnia and Herzegovina | 83.6 /100 | #146 | Excellent 19.7% |
| Immigrants | Austria | 83.1 /100 | #147 | Excellent 19.7% |
| Immigrants | Latin America | 81.3 /100 | #148 | Excellent 19.7% |