Czech vs Immigrants from Cuba 3 or more Vehicles in Household
COMPARE
Czech
Immigrants from Cuba
3 or more Vehicles in Household
3 or more Vehicles in Household Comparison
Czechs
Immigrants from Cuba
22.5%
3 OR MORE VEHICLES IN HOUSEHOLD
100.0/ 100
METRIC RATING
53rd/ 347
METRIC RANK
18.8%
3 OR MORE VEHICLES IN HOUSEHOLD
11.6/ 100
METRIC RATING
213th/ 347
METRIC RANK
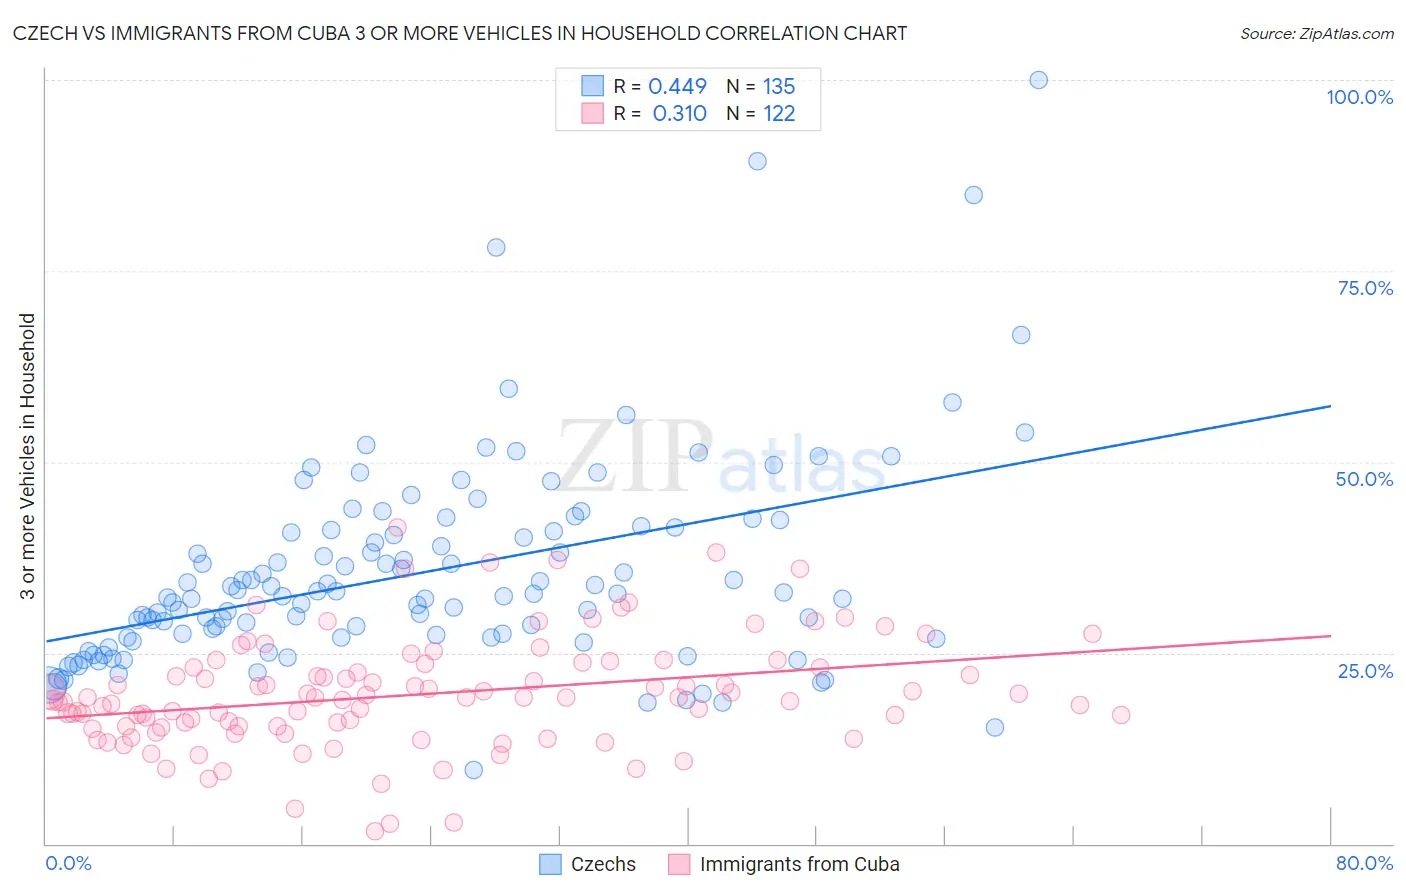
Czech vs Immigrants from Cuba 3 or more Vehicles in Household Correlation Chart
The statistical analysis conducted on geographies consisting of 484,303,845 people shows a moderate positive correlation between the proportion of Czechs and percentage of households with 3 or more vehicles available in the United States with a correlation coefficient (R) of 0.449 and weighted average of 22.5%. Similarly, the statistical analysis conducted on geographies consisting of 325,895,387 people shows a mild positive correlation between the proportion of Immigrants from Cuba and percentage of households with 3 or more vehicles available in the United States with a correlation coefficient (R) of 0.310 and weighted average of 18.8%, a difference of 20.1%.
3 or more Vehicles in Household Correlation Summary
| Measurement | Czech | Immigrants from Cuba |
| Minimum | 9.6% | 1.6% |
| Maximum | 100.0% | 41.4% |
| Range | 90.4% | 39.8% |
| Mean | 35.5% | 19.5% |
| Median | 32.7% | 19.1% |
| Interquartile 25% (IQ1) | 27.0% | 15.3% |
| Interquartile 75% (IQ3) | 41.0% | 23.1% |
| Interquartile Range (IQR) | 14.0% | 7.8% |
| Standard Deviation (Sample) | 13.6% | 7.3% |
| Standard Deviation (Population) | 13.6% | 7.2% |
Similar Demographics by 3 or more Vehicles in Household
Demographics Similar to Czechs by 3 or more Vehicles in Household
In terms of 3 or more vehicles in household, the demographic groups most similar to Czechs are Crow (22.5%, a difference of 0.21%), Welsh (22.6%, a difference of 0.25%), White/Caucasian (22.6%, a difference of 0.29%), Sioux (22.6%, a difference of 0.30%), and Scotch-Irish (22.6%, a difference of 0.36%).
| Demographics | Rating | Rank | 3 or more Vehicles in Household |
| Americans | 100.0 /100 | #46 | Exceptional 22.6% |
| Malaysians | 100.0 /100 | #47 | Exceptional 22.6% |
| Scottish | 100.0 /100 | #48 | Exceptional 22.6% |
| Scotch-Irish | 100.0 /100 | #49 | Exceptional 22.6% |
| Sioux | 100.0 /100 | #50 | Exceptional 22.6% |
| Whites/Caucasians | 100.0 /100 | #51 | Exceptional 22.6% |
| Welsh | 100.0 /100 | #52 | Exceptional 22.6% |
| Czechs | 100.0 /100 | #53 | Exceptional 22.5% |
| Crow | 100.0 /100 | #54 | Exceptional 22.5% |
| Immigrants | Laos | 100.0 /100 | #55 | Exceptional 22.4% |
| Hispanics or Latinos | 100.0 /100 | #56 | Exceptional 22.4% |
| Pennsylvania Germans | 100.0 /100 | #57 | Exceptional 22.3% |
| Spaniards | 100.0 /100 | #58 | Exceptional 22.3% |
| Navajo | 100.0 /100 | #59 | Exceptional 22.3% |
| Finns | 99.9 /100 | #60 | Exceptional 22.3% |
Demographics Similar to Immigrants from Cuba by 3 or more Vehicles in Household
In terms of 3 or more vehicles in household, the demographic groups most similar to Immigrants from Cuba are Panamanian (18.8%, a difference of 0.010%), Immigrants from Kenya (18.8%, a difference of 0.15%), Immigrants from Sierra Leone (18.7%, a difference of 0.15%), Eastern European (18.7%, a difference of 0.20%), and Immigrants from Nigeria (18.7%, a difference of 0.26%).
| Demographics | Rating | Rank | 3 or more Vehicles in Household |
| Immigrants | Eastern Asia | 14.1 /100 | #206 | Poor 18.8% |
| Immigrants | Chile | 13.6 /100 | #207 | Poor 18.8% |
| Immigrants | Burma/Myanmar | 13.6 /100 | #208 | Poor 18.8% |
| Immigrants | Egypt | 13.5 /100 | #209 | Poor 18.8% |
| Bulgarians | 13.1 /100 | #210 | Poor 18.8% |
| Immigrants | Kenya | 12.4 /100 | #211 | Poor 18.8% |
| Panamanians | 11.6 /100 | #212 | Poor 18.8% |
| Immigrants | Cuba | 11.6 /100 | #213 | Poor 18.8% |
| Immigrants | Sierra Leone | 10.8 /100 | #214 | Poor 18.7% |
| Eastern Europeans | 10.6 /100 | #215 | Poor 18.7% |
| Immigrants | Nigeria | 10.3 /100 | #216 | Poor 18.7% |
| Immigrants | Italy | 10.2 /100 | #217 | Poor 18.7% |
| Immigrants | Portugal | 8.9 /100 | #218 | Tragic 18.6% |
| Immigrants | Armenia | 8.6 /100 | #219 | Tragic 18.6% |
| Nigerians | 7.9 /100 | #220 | Tragic 18.6% |