Czech vs Cajun 3 or more Vehicles in Household
COMPARE
Czech
Cajun
3 or more Vehicles in Household
3 or more Vehicles in Household Comparison
Czechs
Cajuns
22.5%
3 OR MORE VEHICLES IN HOUSEHOLD
100.0/ 100
METRIC RATING
53rd/ 347
METRIC RANK
19.3%
3 OR MORE VEHICLES IN HOUSEHOLD
36.0/ 100
METRIC RATING
183rd/ 347
METRIC RANK
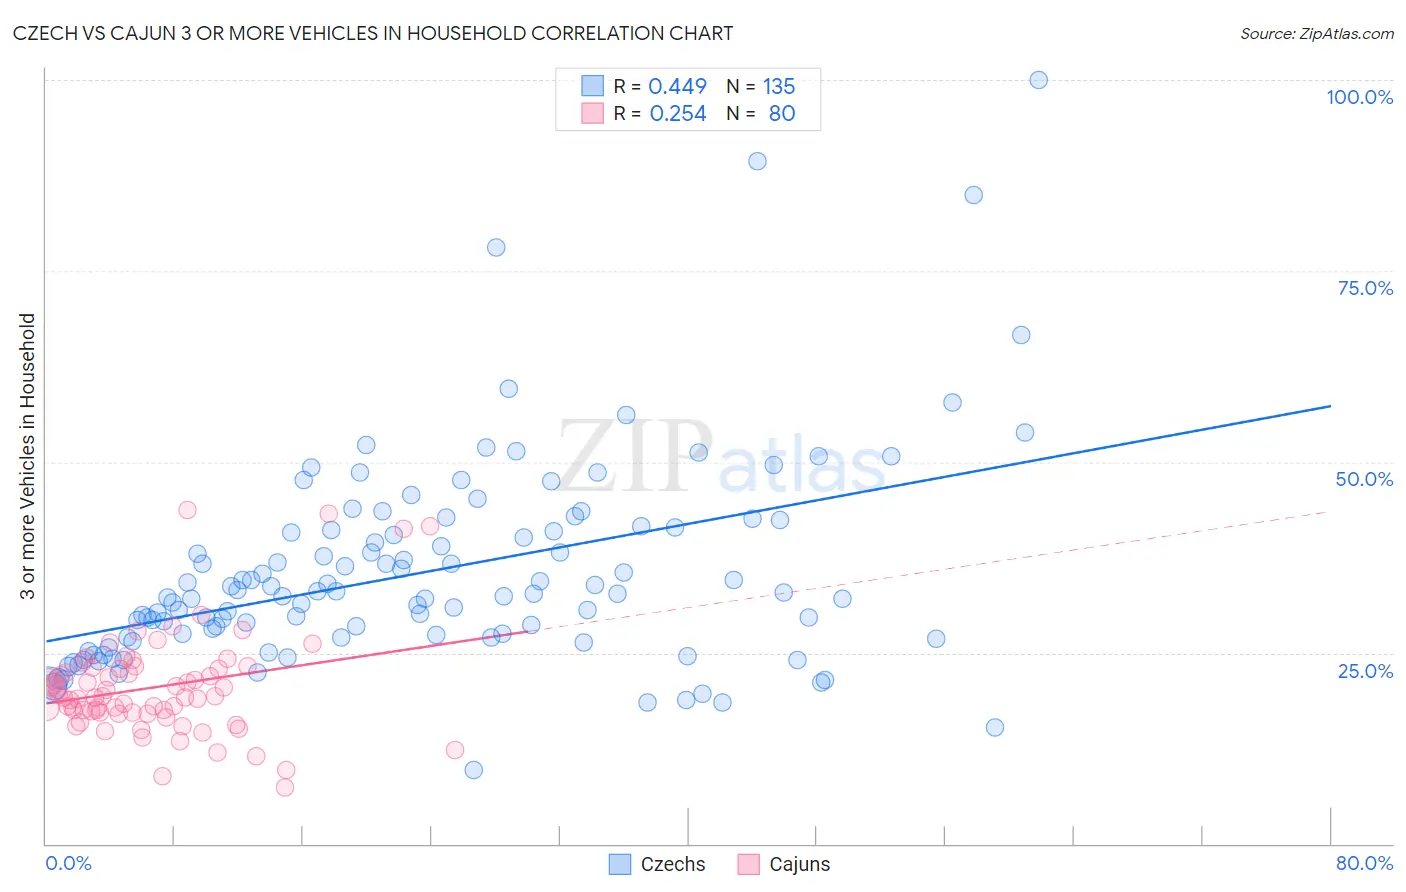
Czech vs Cajun 3 or more Vehicles in Household Correlation Chart
The statistical analysis conducted on geographies consisting of 484,303,845 people shows a moderate positive correlation between the proportion of Czechs and percentage of households with 3 or more vehicles available in the United States with a correlation coefficient (R) of 0.449 and weighted average of 22.5%. Similarly, the statistical analysis conducted on geographies consisting of 149,681,438 people shows a weak positive correlation between the proportion of Cajuns and percentage of households with 3 or more vehicles available in the United States with a correlation coefficient (R) of 0.254 and weighted average of 19.3%, a difference of 16.7%.
3 or more Vehicles in Household Correlation Summary
| Measurement | Czech | Cajun |
| Minimum | 9.6% | 7.4% |
| Maximum | 100.0% | 43.7% |
| Range | 90.4% | 36.2% |
| Mean | 35.5% | 20.5% |
| Median | 32.7% | 19.2% |
| Interquartile 25% (IQ1) | 27.0% | 17.2% |
| Interquartile 75% (IQ3) | 41.0% | 22.9% |
| Interquartile Range (IQR) | 14.0% | 5.7% |
| Standard Deviation (Sample) | 13.6% | 6.7% |
| Standard Deviation (Population) | 13.6% | 6.7% |
Similar Demographics by 3 or more Vehicles in Household
Demographics Similar to Czechs by 3 or more Vehicles in Household
In terms of 3 or more vehicles in household, the demographic groups most similar to Czechs are Crow (22.5%, a difference of 0.21%), Welsh (22.6%, a difference of 0.25%), White/Caucasian (22.6%, a difference of 0.29%), Sioux (22.6%, a difference of 0.30%), and Scotch-Irish (22.6%, a difference of 0.36%).
| Demographics | Rating | Rank | 3 or more Vehicles in Household |
| Americans | 100.0 /100 | #46 | Exceptional 22.6% |
| Malaysians | 100.0 /100 | #47 | Exceptional 22.6% |
| Scottish | 100.0 /100 | #48 | Exceptional 22.6% |
| Scotch-Irish | 100.0 /100 | #49 | Exceptional 22.6% |
| Sioux | 100.0 /100 | #50 | Exceptional 22.6% |
| Whites/Caucasians | 100.0 /100 | #51 | Exceptional 22.6% |
| Welsh | 100.0 /100 | #52 | Exceptional 22.6% |
| Czechs | 100.0 /100 | #53 | Exceptional 22.5% |
| Crow | 100.0 /100 | #54 | Exceptional 22.5% |
| Immigrants | Laos | 100.0 /100 | #55 | Exceptional 22.4% |
| Hispanics or Latinos | 100.0 /100 | #56 | Exceptional 22.4% |
| Pennsylvania Germans | 100.0 /100 | #57 | Exceptional 22.3% |
| Spaniards | 100.0 /100 | #58 | Exceptional 22.3% |
| Navajo | 100.0 /100 | #59 | Exceptional 22.3% |
| Finns | 99.9 /100 | #60 | Exceptional 22.3% |
Demographics Similar to Cajuns by 3 or more Vehicles in Household
In terms of 3 or more vehicles in household, the demographic groups most similar to Cajuns are Latvian (19.3%, a difference of 0.020%), Cuban (19.3%, a difference of 0.050%), Romanian (19.3%, a difference of 0.090%), South African (19.3%, a difference of 0.13%), and Immigrants from South Central Asia (19.3%, a difference of 0.24%).
| Demographics | Rating | Rank | 3 or more Vehicles in Household |
| Iroquois | 46.0 /100 | #176 | Average 19.4% |
| Immigrants | Peru | 41.1 /100 | #177 | Average 19.4% |
| Immigrants | Syria | 40.3 /100 | #178 | Average 19.4% |
| Immigrants | South Central Asia | 38.9 /100 | #179 | Fair 19.3% |
| South Africans | 37.5 /100 | #180 | Fair 19.3% |
| Romanians | 37.1 /100 | #181 | Fair 19.3% |
| Cubans | 36.6 /100 | #182 | Fair 19.3% |
| Cajuns | 36.0 /100 | #183 | Fair 19.3% |
| Latvians | 35.7 /100 | #184 | Fair 19.3% |
| Immigrants | Sri Lanka | 30.7 /100 | #185 | Fair 19.2% |
| Immigrants | Sweden | 29.0 /100 | #186 | Fair 19.2% |
| Immigrants | Hong Kong | 28.3 /100 | #187 | Fair 19.2% |
| Immigrants | Kuwait | 26.1 /100 | #188 | Fair 19.1% |
| Indians (Asian) | 26.0 /100 | #189 | Fair 19.1% |
| Immigrants | Zimbabwe | 25.5 /100 | #190 | Fair 19.1% |