Czech vs Bhutanese Unemployment Among Ages 25 to 29 years
COMPARE
Czech
Bhutanese
Unemployment Among Ages 25 to 29 years
Unemployment Among Ages 25 to 29 years Comparison
Czechs
Bhutanese
6.2%
UNEMPLOYMENT AMONG AGES 25 TO 29 YEARS
99.2/ 100
METRIC RATING
43rd/ 347
METRIC RANK
6.2%
UNEMPLOYMENT AMONG AGES 25 TO 29 YEARS
98.2/ 100
METRIC RATING
61st/ 347
METRIC RANK
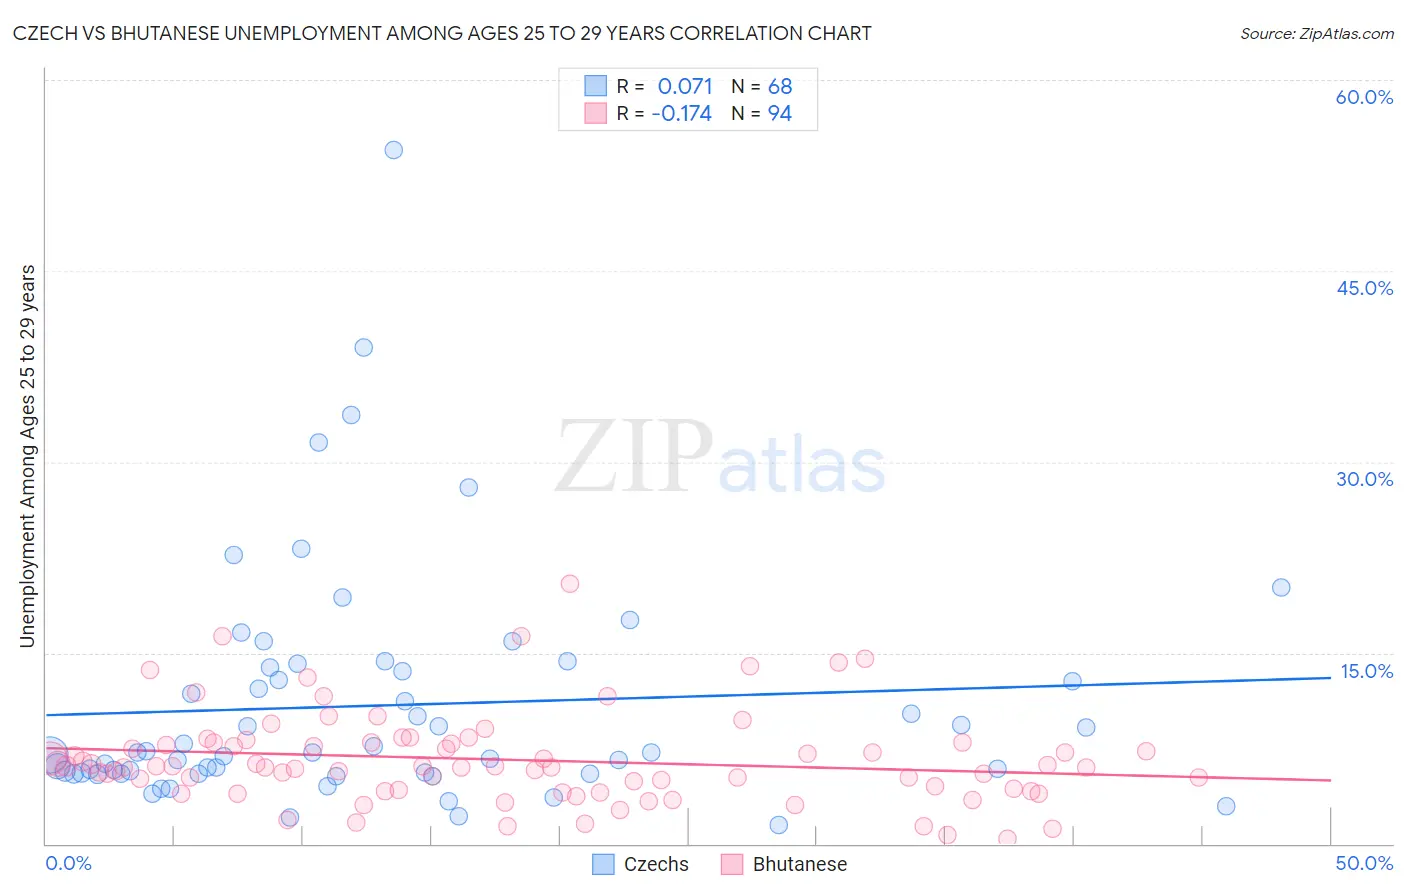
Czech vs Bhutanese Unemployment Among Ages 25 to 29 years Correlation Chart
The statistical analysis conducted on geographies consisting of 444,173,267 people shows a slight positive correlation between the proportion of Czechs and unemployment rate among population between the ages 25 and 29 in the United States with a correlation coefficient (R) of 0.071 and weighted average of 6.2%. Similarly, the statistical analysis conducted on geographies consisting of 428,111,188 people shows a poor negative correlation between the proportion of Bhutanese and unemployment rate among population between the ages 25 and 29 in the United States with a correlation coefficient (R) of -0.174 and weighted average of 6.2%, a difference of 1.4%.
Unemployment Among Ages 25 to 29 years Correlation Summary
| Measurement | Czech | Bhutanese |
| Minimum | 1.5% | 0.40% |
| Maximum | 54.5% | 20.5% |
| Range | 53.0% | 20.1% |
| Mean | 10.9% | 6.6% |
| Median | 7.2% | 6.0% |
| Interquartile 25% (IQ1) | 5.6% | 4.2% |
| Interquartile 75% (IQ3) | 13.7% | 7.9% |
| Interquartile Range (IQR) | 8.1% | 3.7% |
| Standard Deviation (Sample) | 9.3% | 3.6% |
| Standard Deviation (Population) | 9.2% | 3.6% |
Demographics Similar to Czechs and Bhutanese by Unemployment Among Ages 25 to 29 years
In terms of unemployment among ages 25 to 29 years, the demographic groups most similar to Czechs are Mongolian (6.2%, a difference of 0.040%), Jordanian (6.1%, a difference of 0.13%), Venezuelan (6.2%, a difference of 0.24%), Immigrants from Lithuania (6.2%, a difference of 0.33%), and Latvian (6.2%, a difference of 0.34%). Similarly, the demographic groups most similar to Bhutanese are Immigrants from China (6.2%, a difference of 0.10%), Immigrants from Taiwan (6.2%, a difference of 0.12%), Luxembourger (6.2%, a difference of 0.15%), Immigrants from Eastern Asia (6.2%, a difference of 0.28%), and Immigrants from Saudi Arabia (6.2%, a difference of 0.44%).
| Demographics | Rating | Rank | Unemployment Among Ages 25 to 29 years |
| Jordanians | 99.3 /100 | #42 | Exceptional 6.1% |
| Czechs | 99.2 /100 | #43 | Exceptional 6.2% |
| Mongolians | 99.2 /100 | #44 | Exceptional 6.2% |
| Venezuelans | 99.1 /100 | #45 | Exceptional 6.2% |
| Immigrants | Lithuania | 99.0 /100 | #46 | Exceptional 6.2% |
| Latvians | 99.0 /100 | #47 | Exceptional 6.2% |
| Immigrants | Australia | 99.0 /100 | #48 | Exceptional 6.2% |
| German Russians | 99.0 /100 | #49 | Exceptional 6.2% |
| Soviet Union | 98.9 /100 | #50 | Exceptional 6.2% |
| Burmese | 98.9 /100 | #51 | Exceptional 6.2% |
| Immigrants | Turkey | 98.9 /100 | #52 | Exceptional 6.2% |
| Turks | 98.8 /100 | #53 | Exceptional 6.2% |
| Swedes | 98.8 /100 | #54 | Exceptional 6.2% |
| Immigrants | Netherlands | 98.7 /100 | #55 | Exceptional 6.2% |
| Immigrants | Burma/Myanmar | 98.7 /100 | #56 | Exceptional 6.2% |
| Immigrants | Saudi Arabia | 98.6 /100 | #57 | Exceptional 6.2% |
| Immigrants | Eastern Asia | 98.4 /100 | #58 | Exceptional 6.2% |
| Luxembourgers | 98.3 /100 | #59 | Exceptional 6.2% |
| Immigrants | Taiwan | 98.3 /100 | #60 | Exceptional 6.2% |
| Bhutanese | 98.2 /100 | #61 | Exceptional 6.2% |
| Immigrants | China | 98.1 /100 | #62 | Exceptional 6.2% |