Creek vs Palestinian 2 or more Vehicles in Household
COMPARE
Creek
Palestinian
2 or more Vehicles in Household
2 or more Vehicles in Household Comparison
Creek
Palestinians
58.3%
2 OR MORE VEHICLES IN HOUSEHOLD
99.5/ 100
METRIC RATING
76th/ 347
METRIC RANK
57.7%
2 OR MORE VEHICLES IN HOUSEHOLD
98.6/ 100
METRIC RATING
98th/ 347
METRIC RANK
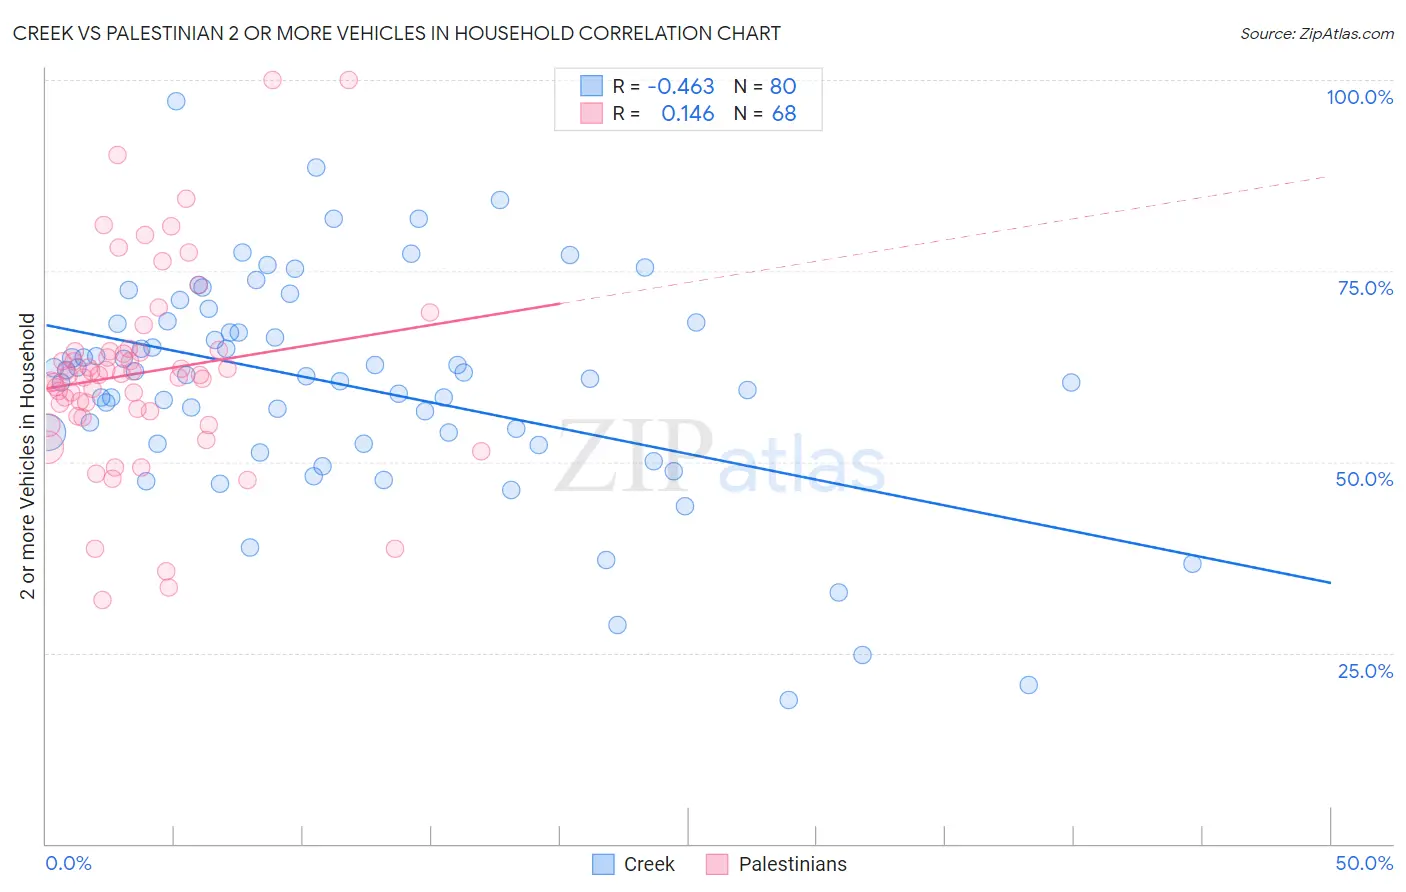
Creek vs Palestinian 2 or more Vehicles in Household Correlation Chart
The statistical analysis conducted on geographies consisting of 178,443,711 people shows a moderate negative correlation between the proportion of Creek and percentage of households with 2 or more vehicles available in the United States with a correlation coefficient (R) of -0.463 and weighted average of 58.3%. Similarly, the statistical analysis conducted on geographies consisting of 216,408,770 people shows a poor positive correlation between the proportion of Palestinians and percentage of households with 2 or more vehicles available in the United States with a correlation coefficient (R) of 0.146 and weighted average of 57.7%, a difference of 1.0%.
2 or more Vehicles in Household Correlation Summary
| Measurement | Creek | Palestinian |
| Minimum | 18.9% | 31.8% |
| Maximum | 97.2% | 100.0% |
| Range | 78.3% | 68.2% |
| Mean | 59.9% | 61.7% |
| Median | 61.3% | 61.4% |
| Interquartile 25% (IQ1) | 52.3% | 56.3% |
| Interquartile 75% (IQ3) | 68.2% | 64.5% |
| Interquartile Range (IQR) | 15.8% | 8.1% |
| Standard Deviation (Sample) | 14.4% | 13.0% |
| Standard Deviation (Population) | 14.4% | 12.9% |
Similar Demographics by 2 or more Vehicles in Household
Demographics Similar to Creek by 2 or more Vehicles in Household
In terms of 2 or more vehicles in household, the demographic groups most similar to Creek are Slovene (58.3%, a difference of 0.010%), Polish (58.3%, a difference of 0.030%), Lithuanian (58.2%, a difference of 0.060%), Immigrants from Afghanistan (58.3%, a difference of 0.11%), and Bolivian (58.3%, a difference of 0.12%).
| Demographics | Rating | Rank | 2 or more Vehicles in Household |
| Pennsylvania Germans | 99.7 /100 | #69 | Exceptional 58.5% |
| Italians | 99.6 /100 | #70 | Exceptional 58.4% |
| Bangladeshis | 99.6 /100 | #71 | Exceptional 58.4% |
| Austrians | 99.6 /100 | #72 | Exceptional 58.4% |
| Bolivians | 99.6 /100 | #73 | Exceptional 58.3% |
| Immigrants | Afghanistan | 99.6 /100 | #74 | Exceptional 58.3% |
| Poles | 99.5 /100 | #75 | Exceptional 58.3% |
| Creek | 99.5 /100 | #76 | Exceptional 58.3% |
| Slovenes | 99.5 /100 | #77 | Exceptional 58.3% |
| Lithuanians | 99.5 /100 | #78 | Exceptional 58.2% |
| Delaware | 99.4 /100 | #79 | Exceptional 58.2% |
| Immigrants | England | 99.3 /100 | #80 | Exceptional 58.1% |
| Immigrants | Iraq | 99.3 /100 | #81 | Exceptional 58.1% |
| Iranians | 99.3 /100 | #82 | Exceptional 58.1% |
| Icelanders | 99.2 /100 | #83 | Exceptional 58.0% |
Demographics Similar to Palestinians by 2 or more Vehicles in Household
In terms of 2 or more vehicles in household, the demographic groups most similar to Palestinians are Cajun (57.7%, a difference of 0.070%), Fijian (57.6%, a difference of 0.14%), Slavic (57.8%, a difference of 0.15%), Burmese (57.8%, a difference of 0.17%), and Lebanese (57.6%, a difference of 0.19%).
| Demographics | Rating | Rank | 2 or more Vehicles in Household |
| Pakistanis | 99.0 /100 | #91 | Exceptional 57.9% |
| Shoshone | 99.0 /100 | #92 | Exceptional 57.9% |
| Ottawa | 99.0 /100 | #93 | Exceptional 57.9% |
| Filipinos | 98.9 /100 | #94 | Exceptional 57.8% |
| Hmong | 98.9 /100 | #95 | Exceptional 57.8% |
| Burmese | 98.8 /100 | #96 | Exceptional 57.8% |
| Slavs | 98.8 /100 | #97 | Exceptional 57.8% |
| Palestinians | 98.6 /100 | #98 | Exceptional 57.7% |
| Cajuns | 98.5 /100 | #99 | Exceptional 57.7% |
| Fijians | 98.4 /100 | #100 | Exceptional 57.6% |
| Lebanese | 98.3 /100 | #101 | Exceptional 57.6% |
| Immigrants | Bolivia | 98.2 /100 | #102 | Exceptional 57.6% |
| Jordanians | 98.2 /100 | #103 | Exceptional 57.6% |
| Immigrants | Indonesia | 98.2 /100 | #104 | Exceptional 57.6% |
| Immigrants | Korea | 98.2 /100 | #105 | Exceptional 57.6% |