Creek vs Immigrants from Nigeria In Labor Force | Age 45-54
COMPARE
Creek
Immigrants from Nigeria
In Labor Force | Age 45-54
In Labor Force | Age 45-54 Comparison
Creek
Immigrants from Nigeria
77.7%
IN LABOR FORCE | AGE 45-54
0.0/ 100
METRIC RATING
329th/ 347
METRIC RANK
83.0%
IN LABOR FORCE | AGE 45-54
74.1/ 100
METRIC RATING
148th/ 347
METRIC RANK
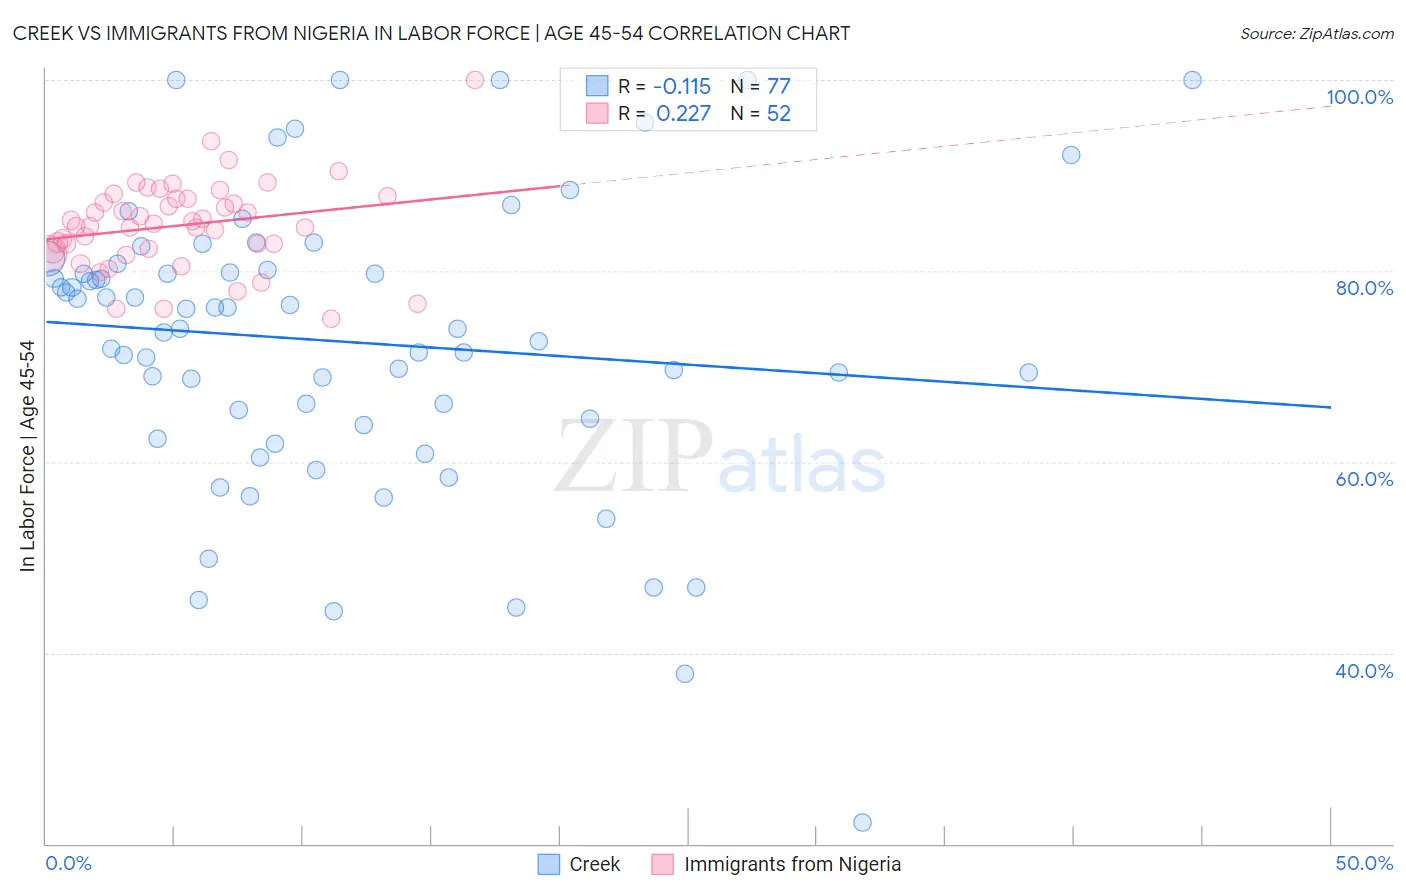
Creek vs Immigrants from Nigeria In Labor Force | Age 45-54 Correlation Chart
The statistical analysis conducted on geographies consisting of 178,432,423 people shows a poor negative correlation between the proportion of Creek and labor force participation rate among population between the ages 45 and 54 in the United States with a correlation coefficient (R) of -0.115 and weighted average of 77.7%. Similarly, the statistical analysis conducted on geographies consisting of 283,287,443 people shows a weak positive correlation between the proportion of Immigrants from Nigeria and labor force participation rate among population between the ages 45 and 54 in the United States with a correlation coefficient (R) of 0.227 and weighted average of 83.0%, a difference of 6.7%.
In Labor Force | Age 45-54 Correlation Summary
| Measurement | Creek | Immigrants from Nigeria |
| Minimum | 22.2% | 75.0% |
| Maximum | 100.0% | 100.0% |
| Range | 77.8% | 25.0% |
| Mean | 72.6% | 84.8% |
| Median | 74.0% | 84.8% |
| Interquartile 25% (IQ1) | 64.2% | 82.2% |
| Interquartile 75% (IQ3) | 80.4% | 87.5% |
| Interquartile Range (IQR) | 16.2% | 5.3% |
| Standard Deviation (Sample) | 15.3% | 4.6% |
| Standard Deviation (Population) | 15.2% | 4.6% |
Similar Demographics by In Labor Force | Age 45-54
Demographics Similar to Creek by In Labor Force | Age 45-54
In terms of in labor force | age 45-54, the demographic groups most similar to Creek are Cheyenne (77.6%, a difference of 0.22%), Sioux (78.0%, a difference of 0.29%), Tsimshian (77.4%, a difference of 0.37%), Menominee (77.4%, a difference of 0.41%), and Cajun (78.1%, a difference of 0.51%).
| Demographics | Rating | Rank | In Labor Force | Age 45-54 |
| Crow | 0.0 /100 | #322 | Tragic 78.3% |
| Kiowa | 0.0 /100 | #323 | Tragic 78.3% |
| Dutch West Indians | 0.0 /100 | #324 | Tragic 78.2% |
| Choctaw | 0.0 /100 | #325 | Tragic 78.2% |
| Seminole | 0.0 /100 | #326 | Tragic 78.1% |
| Cajuns | 0.0 /100 | #327 | Tragic 78.1% |
| Sioux | 0.0 /100 | #328 | Tragic 78.0% |
| Creek | 0.0 /100 | #329 | Tragic 77.7% |
| Cheyenne | 0.0 /100 | #330 | Tragic 77.6% |
| Tsimshian | 0.0 /100 | #331 | Tragic 77.4% |
| Menominee | 0.0 /100 | #332 | Tragic 77.4% |
| Natives/Alaskans | 0.0 /100 | #333 | Tragic 77.1% |
| Apache | 0.0 /100 | #334 | Tragic 77.1% |
| Arapaho | 0.0 /100 | #335 | Tragic 77.1% |
| Paiute | 0.0 /100 | #336 | Tragic 76.7% |
Demographics Similar to Immigrants from Nigeria by In Labor Force | Age 45-54
In terms of in labor force | age 45-54, the demographic groups most similar to Immigrants from Nigeria are Immigrants from France (83.0%, a difference of 0.010%), Czechoslovakian (83.0%, a difference of 0.010%), Immigrants from Sweden (82.9%, a difference of 0.010%), Romanian (83.0%, a difference of 0.020%), and Immigrants from Netherlands (82.9%, a difference of 0.020%).
| Demographics | Rating | Rank | In Labor Force | Age 45-54 |
| Immigrants | Haiti | 77.9 /100 | #141 | Good 83.0% |
| Immigrants | Scotland | 77.8 /100 | #142 | Good 83.0% |
| Okinawans | 77.0 /100 | #143 | Good 83.0% |
| Soviet Union | 76.8 /100 | #144 | Good 83.0% |
| Romanians | 75.4 /100 | #145 | Good 83.0% |
| Immigrants | France | 75.3 /100 | #146 | Good 83.0% |
| Czechoslovakians | 74.8 /100 | #147 | Good 83.0% |
| Immigrants | Nigeria | 74.1 /100 | #148 | Good 83.0% |
| Immigrants | Sweden | 73.3 /100 | #149 | Good 82.9% |
| Immigrants | Netherlands | 72.6 /100 | #150 | Good 82.9% |
| Koreans | 71.9 /100 | #151 | Good 82.9% |
| Slavs | 71.5 /100 | #152 | Good 82.9% |
| Immigrants | Indonesia | 70.6 /100 | #153 | Good 82.9% |
| Immigrants | Ghana | 70.3 /100 | #154 | Good 82.9% |
| Immigrants | Philippines | 69.0 /100 | #155 | Good 82.9% |