Creek vs Immigrants from Hungary 1 or more Vehicles in Household
COMPARE
Creek
Immigrants from Hungary
1 or more Vehicles in Household
1 or more Vehicles in Household Comparison
Creek
Immigrants from Hungary
92.3%
1 OR MORE VEHICLES IN HOUSEHOLD
99.9/ 100
METRIC RATING
40th/ 347
METRIC RANK
89.0%
1 OR MORE VEHICLES IN HOUSEHOLD
11.9/ 100
METRIC RATING
214th/ 347
METRIC RANK
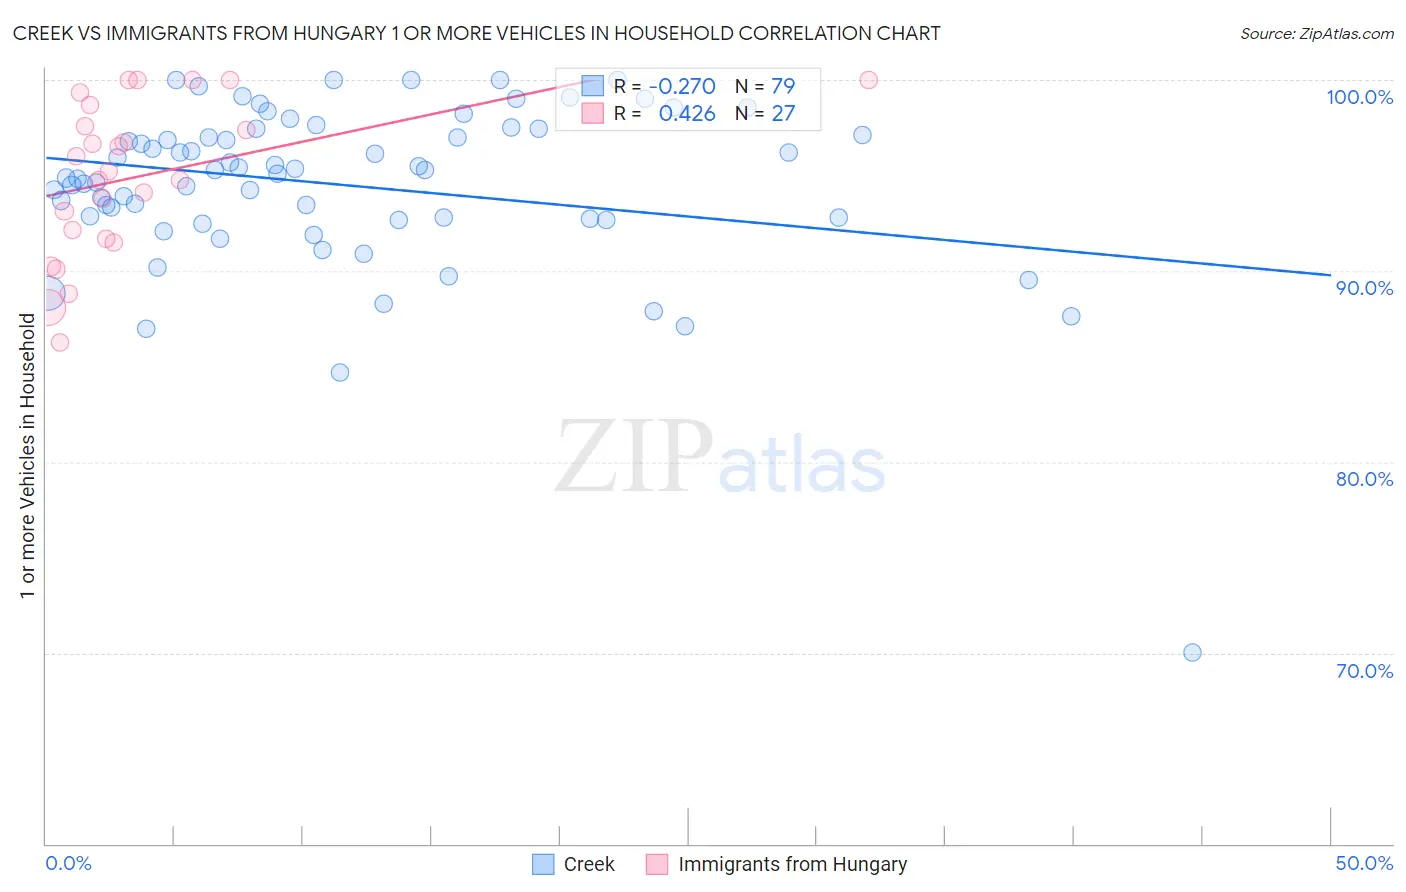
Creek vs Immigrants from Hungary 1 or more Vehicles in Household Correlation Chart
The statistical analysis conducted on geographies consisting of 178,443,549 people shows a weak negative correlation between the proportion of Creek and percentage of households with 1 or more vehicles available in the United States with a correlation coefficient (R) of -0.270 and weighted average of 92.3%. Similarly, the statistical analysis conducted on geographies consisting of 195,676,592 people shows a moderate positive correlation between the proportion of Immigrants from Hungary and percentage of households with 1 or more vehicles available in the United States with a correlation coefficient (R) of 0.426 and weighted average of 89.0%, a difference of 3.7%.
1 or more Vehicles in Household Correlation Summary
| Measurement | Creek | Immigrants from Hungary |
| Minimum | 70.0% | 86.3% |
| Maximum | 100.0% | 100.0% |
| Range | 30.0% | 13.7% |
| Mean | 94.5% | 94.9% |
| Median | 95.3% | 95.3% |
| Interquartile 25% (IQ1) | 92.7% | 91.7% |
| Interquartile 75% (IQ3) | 97.4% | 98.7% |
| Interquartile Range (IQR) | 4.7% | 7.0% |
| Standard Deviation (Sample) | 4.5% | 4.0% |
| Standard Deviation (Population) | 4.4% | 4.0% |
Similar Demographics by 1 or more Vehicles in Household
Demographics Similar to Creek by 1 or more Vehicles in Household
In terms of 1 or more vehicles in household, the demographic groups most similar to Creek are Swiss (92.3%, a difference of 0.0%), French Canadian (92.3%, a difference of 0.010%), Immigrants from Vietnam (92.3%, a difference of 0.010%), Czechoslovakian (92.3%, a difference of 0.020%), and Malaysian (92.3%, a difference of 0.020%).
| Demographics | Rating | Rank | 1 or more Vehicles in Household |
| Cherokee | 100.0 /100 | #33 | Exceptional 92.4% |
| Italians | 99.9 /100 | #34 | Exceptional 92.3% |
| Czechoslovakians | 99.9 /100 | #35 | Exceptional 92.3% |
| Malaysians | 99.9 /100 | #36 | Exceptional 92.3% |
| French Canadians | 99.9 /100 | #37 | Exceptional 92.3% |
| Immigrants | Vietnam | 99.9 /100 | #38 | Exceptional 92.3% |
| Swiss | 99.9 /100 | #39 | Exceptional 92.3% |
| Creek | 99.9 /100 | #40 | Exceptional 92.3% |
| Immigrants | Taiwan | 99.9 /100 | #41 | Exceptional 92.3% |
| Chickasaw | 99.9 /100 | #42 | Exceptional 92.3% |
| Spanish | 99.9 /100 | #43 | Exceptional 92.3% |
| Choctaw | 99.9 /100 | #44 | Exceptional 92.2% |
| Immigrants | Nonimmigrants | 99.9 /100 | #45 | Exceptional 92.2% |
| Immigrants | Fiji | 99.9 /100 | #46 | Exceptional 92.2% |
| Northern Europeans | 99.9 /100 | #47 | Exceptional 92.2% |
Demographics Similar to Immigrants from Hungary by 1 or more Vehicles in Household
In terms of 1 or more vehicles in household, the demographic groups most similar to Immigrants from Hungary are Immigrants from Western Asia (89.0%, a difference of 0.010%), Somali (89.0%, a difference of 0.030%), Sierra Leonean (89.0%, a difference of 0.040%), Dutch West Indian (89.0%, a difference of 0.060%), and Immigrants from Italy (89.1%, a difference of 0.070%).
| Demographics | Rating | Rank | 1 or more Vehicles in Household |
| Immigrants | Denmark | 14.8 /100 | #207 | Poor 89.1% |
| Immigrants | Chile | 14.4 /100 | #208 | Poor 89.1% |
| Immigrants | Italy | 14.0 /100 | #209 | Poor 89.1% |
| Dutch West Indians | 13.5 /100 | #210 | Poor 89.0% |
| Sierra Leoneans | 13.0 /100 | #211 | Poor 89.0% |
| Somalis | 12.8 /100 | #212 | Poor 89.0% |
| Immigrants | Western Asia | 12.3 /100 | #213 | Poor 89.0% |
| Immigrants | Hungary | 11.9 /100 | #214 | Poor 89.0% |
| Immigrants | Sri Lanka | 10.2 /100 | #215 | Poor 88.9% |
| Immigrants | Argentina | 9.4 /100 | #216 | Tragic 88.9% |
| Argentineans | 8.8 /100 | #217 | Tragic 88.9% |
| Ugandans | 8.7 /100 | #218 | Tragic 88.9% |
| Immigrants | Guatemala | 8.6 /100 | #219 | Tragic 88.9% |
| Immigrants | Zaire | 8.1 /100 | #220 | Tragic 88.8% |
| Peruvians | 7.9 /100 | #221 | Tragic 88.8% |