Creek vs Immigrants from Hungary 2nd Grade
COMPARE
Creek
Immigrants from Hungary
2nd Grade
2nd Grade Comparison
Creek
Immigrants from Hungary
98.3%
2ND GRADE
99.8/ 100
METRIC RATING
60th/ 347
METRIC RANK
98.0%
2ND GRADE
89.7/ 100
METRIC RATING
134th/ 347
METRIC RANK
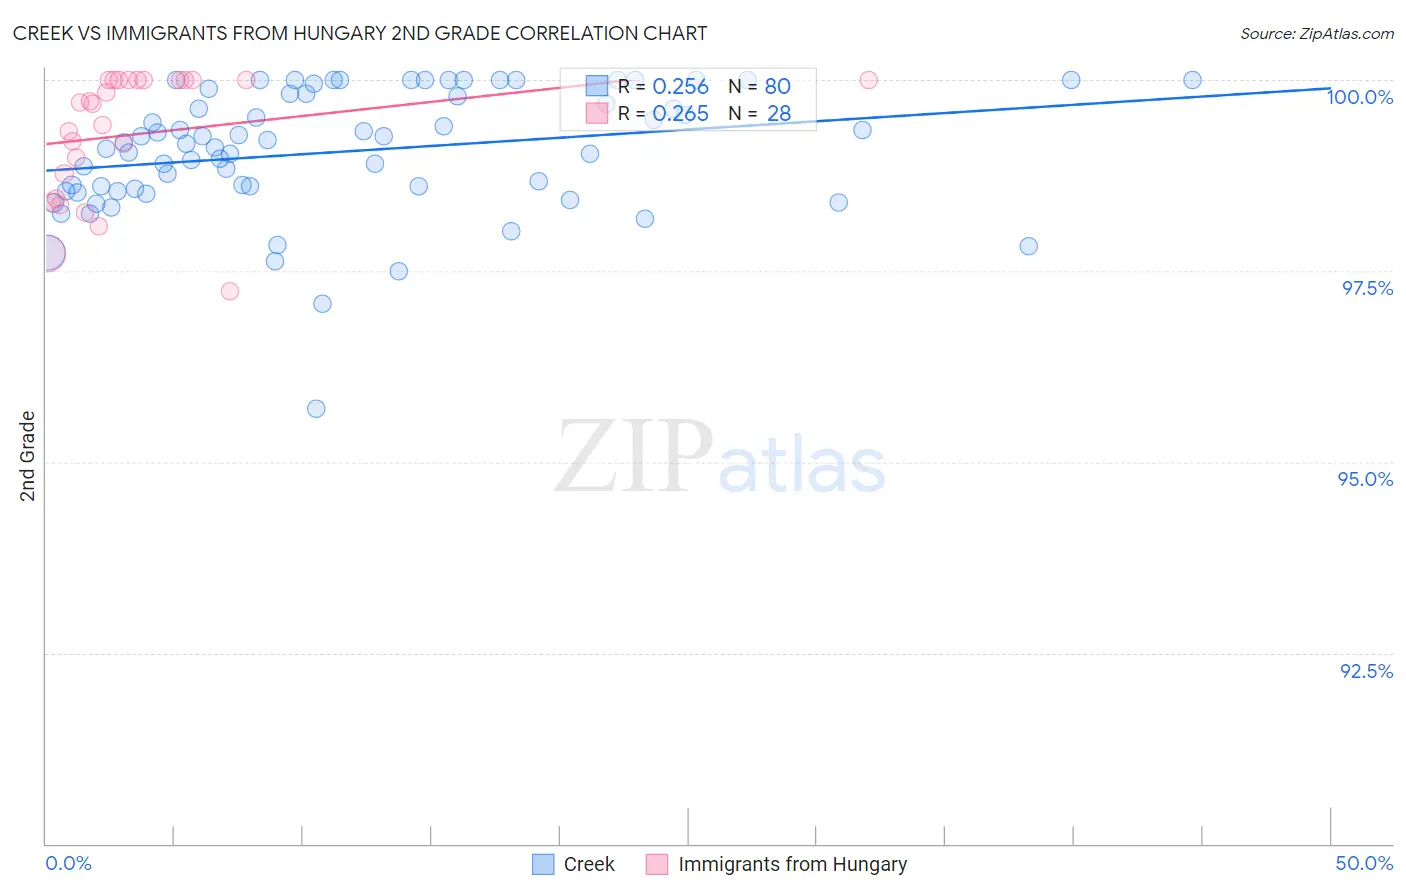
Creek vs Immigrants from Hungary 2nd Grade Correlation Chart
The statistical analysis conducted on geographies consisting of 178,480,663 people shows a weak positive correlation between the proportion of Creek and percentage of population with at least 2nd grade education in the United States with a correlation coefficient (R) of 0.256 and weighted average of 98.3%. Similarly, the statistical analysis conducted on geographies consisting of 195,707,305 people shows a weak positive correlation between the proportion of Immigrants from Hungary and percentage of population with at least 2nd grade education in the United States with a correlation coefficient (R) of 0.265 and weighted average of 98.0%, a difference of 0.30%.
2nd Grade Correlation Summary
| Measurement | Creek | Immigrants from Hungary |
| Minimum | 95.7% | 97.2% |
| Maximum | 100.0% | 100.0% |
| Range | 4.3% | 2.8% |
| Mean | 99.1% | 99.3% |
| Median | 99.2% | 99.7% |
| Interquartile 25% (IQ1) | 98.6% | 98.6% |
| Interquartile 75% (IQ3) | 99.8% | 100.0% |
| Interquartile Range (IQR) | 1.3% | 1.4% |
| Standard Deviation (Sample) | 0.82% | 0.82% |
| Standard Deviation (Population) | 0.82% | 0.81% |
Similar Demographics by 2nd Grade
Demographics Similar to Creek by 2nd Grade
In terms of 2nd grade, the demographic groups most similar to Creek are Slavic (98.3%, a difference of 0.0%), Immigrants from Canada (98.3%, a difference of 0.0%), Greek (98.3%, a difference of 0.0%), Maltese (98.3%, a difference of 0.0%), and American (98.3%, a difference of 0.010%).
| Demographics | Rating | Rank | 2nd Grade |
| Pueblo | 99.8 /100 | #53 | Exceptional 98.3% |
| Kiowa | 99.8 /100 | #54 | Exceptional 98.3% |
| Immigrants | Scotland | 99.8 /100 | #55 | Exceptional 98.3% |
| Americans | 99.8 /100 | #56 | Exceptional 98.3% |
| Austrians | 99.8 /100 | #57 | Exceptional 98.3% |
| Bulgarians | 99.8 /100 | #58 | Exceptional 98.3% |
| Slavs | 99.8 /100 | #59 | Exceptional 98.3% |
| Creek | 99.8 /100 | #60 | Exceptional 98.3% |
| Immigrants | Canada | 99.8 /100 | #61 | Exceptional 98.3% |
| Greeks | 99.8 /100 | #62 | Exceptional 98.3% |
| Maltese | 99.7 /100 | #63 | Exceptional 98.3% |
| Immigrants | North America | 99.7 /100 | #64 | Exceptional 98.3% |
| New Zealanders | 99.7 /100 | #65 | Exceptional 98.3% |
| Canadians | 99.7 /100 | #66 | Exceptional 98.3% |
| Immigrants | Northern Europe | 99.7 /100 | #67 | Exceptional 98.3% |
Demographics Similar to Immigrants from Hungary by 2nd Grade
In terms of 2nd grade, the demographic groups most similar to Immigrants from Hungary are Immigrants from Bulgaria (98.0%, a difference of 0.0%), Immigrants from Kuwait (98.0%, a difference of 0.0%), Seminole (98.0%, a difference of 0.010%), Immigrants from Europe (98.0%, a difference of 0.010%), and Spaniard (98.0%, a difference of 0.010%).
| Demographics | Rating | Rank | 2nd Grade |
| Immigrants | Saudi Arabia | 93.6 /100 | #127 | Exceptional 98.1% |
| Immigrants | Serbia | 92.3 /100 | #128 | Exceptional 98.1% |
| Immigrants | Croatia | 92.1 /100 | #129 | Exceptional 98.1% |
| Seminole | 91.1 /100 | #130 | Exceptional 98.0% |
| Immigrants | Europe | 91.1 /100 | #131 | Exceptional 98.0% |
| Spaniards | 90.7 /100 | #132 | Exceptional 98.0% |
| Cambodians | 90.7 /100 | #133 | Exceptional 98.0% |
| Immigrants | Hungary | 89.7 /100 | #134 | Excellent 98.0% |
| Immigrants | Bulgaria | 89.7 /100 | #135 | Excellent 98.0% |
| Immigrants | Kuwait | 89.2 /100 | #136 | Excellent 98.0% |
| Immigrants | Romania | 88.3 /100 | #137 | Excellent 98.0% |
| Israelis | 87.9 /100 | #138 | Excellent 98.0% |
| Blackfeet | 87.5 /100 | #139 | Excellent 98.0% |
| Palestinians | 83.9 /100 | #140 | Excellent 98.0% |
| Immigrants | Turkey | 83.0 /100 | #141 | Excellent 98.0% |