Alaska Native vs Immigrants from Hungary 1 or more Vehicles in Household
COMPARE
Alaska Native
Immigrants from Hungary
1 or more Vehicles in Household
1 or more Vehicles in Household Comparison
Alaska Natives
Immigrants from Hungary
83.8%
1 OR MORE VEHICLES IN HOUSEHOLD
0.0/ 100
METRIC RATING
316th/ 347
METRIC RANK
89.0%
1 OR MORE VEHICLES IN HOUSEHOLD
11.9/ 100
METRIC RATING
214th/ 347
METRIC RANK
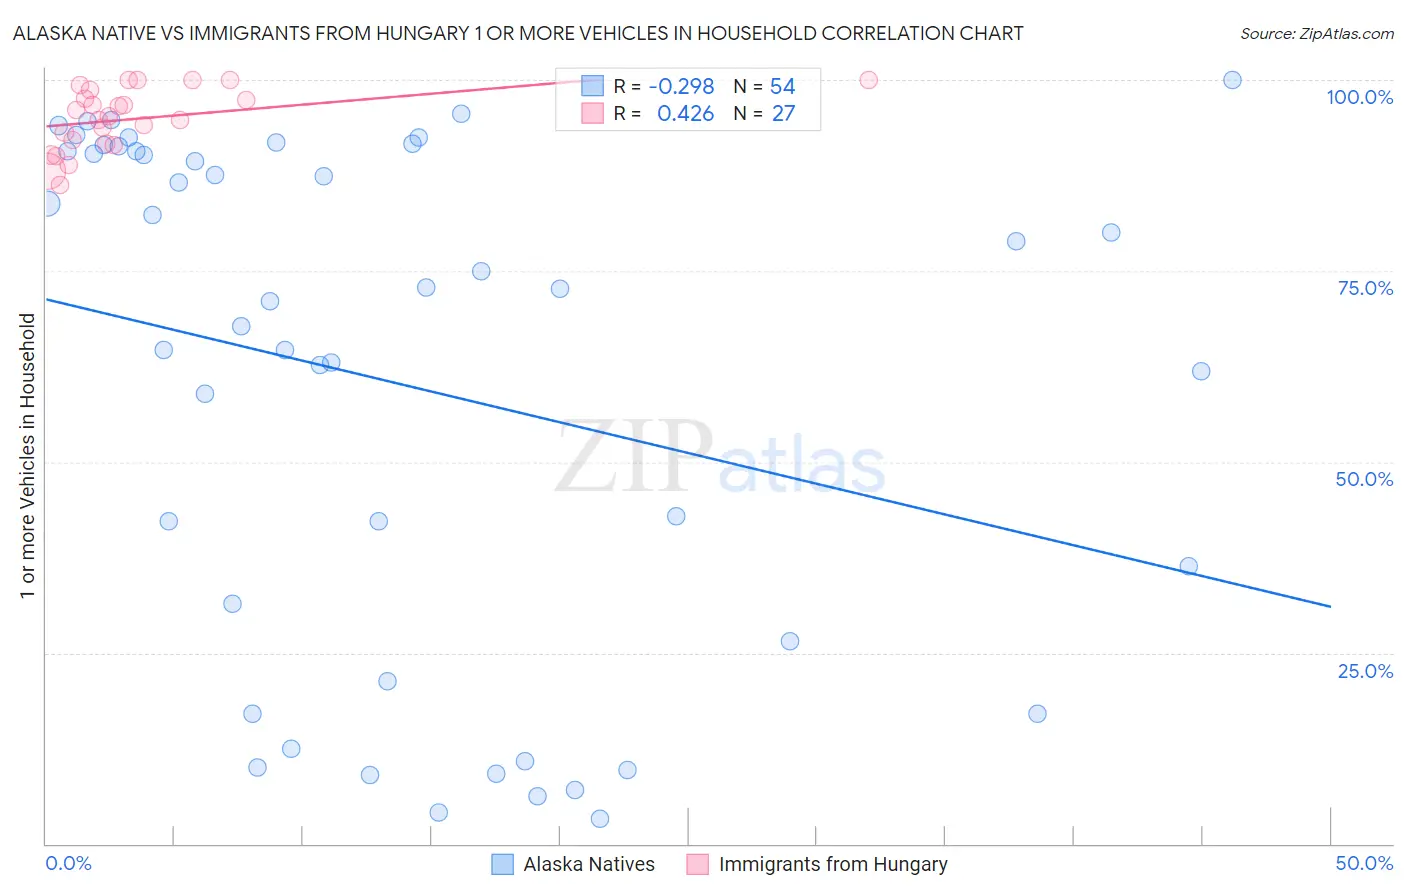
Alaska Native vs Immigrants from Hungary 1 or more Vehicles in Household Correlation Chart
The statistical analysis conducted on geographies consisting of 76,754,392 people shows a weak negative correlation between the proportion of Alaska Natives and percentage of households with 1 or more vehicles available in the United States with a correlation coefficient (R) of -0.298 and weighted average of 83.8%. Similarly, the statistical analysis conducted on geographies consisting of 195,676,592 people shows a moderate positive correlation between the proportion of Immigrants from Hungary and percentage of households with 1 or more vehicles available in the United States with a correlation coefficient (R) of 0.426 and weighted average of 89.0%, a difference of 6.2%.
1 or more Vehicles in Household Correlation Summary
| Measurement | Alaska Native | Immigrants from Hungary |
| Minimum | 3.3% | 86.3% |
| Maximum | 100.0% | 100.0% |
| Range | 96.7% | 13.7% |
| Mean | 60.3% | 94.9% |
| Median | 71.9% | 95.3% |
| Interquartile 25% (IQ1) | 26.5% | 91.7% |
| Interquartile 75% (IQ3) | 90.6% | 98.7% |
| Interquartile Range (IQR) | 64.1% | 7.0% |
| Standard Deviation (Sample) | 33.2% | 4.0% |
| Standard Deviation (Population) | 32.9% | 4.0% |
Similar Demographics by 1 or more Vehicles in Household
Demographics Similar to Alaska Natives by 1 or more Vehicles in Household
In terms of 1 or more vehicles in household, the demographic groups most similar to Alaska Natives are Ghanaian (83.6%, a difference of 0.22%), Immigrants from Ghana (83.4%, a difference of 0.42%), Immigrants from Belarus (83.3%, a difference of 0.55%), Cypriot (84.4%, a difference of 0.69%), and Albanian (84.4%, a difference of 0.76%).
| Demographics | Rating | Rank | 1 or more Vehicles in Household |
| Immigrants | Haiti | 0.0 /100 | #309 | Tragic 84.7% |
| U.S. Virgin Islanders | 0.0 /100 | #310 | Tragic 84.6% |
| Puerto Ricans | 0.0 /100 | #311 | Tragic 84.6% |
| Cape Verdeans | 0.0 /100 | #312 | Tragic 84.5% |
| Immigrants | Israel | 0.0 /100 | #313 | Tragic 84.5% |
| Albanians | 0.0 /100 | #314 | Tragic 84.4% |
| Cypriots | 0.0 /100 | #315 | Tragic 84.4% |
| Alaska Natives | 0.0 /100 | #316 | Tragic 83.8% |
| Ghanaians | 0.0 /100 | #317 | Tragic 83.6% |
| Immigrants | Ghana | 0.0 /100 | #318 | Tragic 83.4% |
| Immigrants | Belarus | 0.0 /100 | #319 | Tragic 83.3% |
| Soviet Union | 0.0 /100 | #320 | Tragic 82.7% |
| Jamaicans | 0.0 /100 | #321 | Tragic 82.1% |
| Immigrants | Cabo Verde | 0.0 /100 | #322 | Tragic 81.6% |
| Immigrants | Yemen | 0.0 /100 | #323 | Tragic 80.5% |
Demographics Similar to Immigrants from Hungary by 1 or more Vehicles in Household
In terms of 1 or more vehicles in household, the demographic groups most similar to Immigrants from Hungary are Immigrants from Western Asia (89.0%, a difference of 0.010%), Somali (89.0%, a difference of 0.030%), Sierra Leonean (89.0%, a difference of 0.040%), Dutch West Indian (89.0%, a difference of 0.060%), and Immigrants from Italy (89.1%, a difference of 0.070%).
| Demographics | Rating | Rank | 1 or more Vehicles in Household |
| Immigrants | Denmark | 14.8 /100 | #207 | Poor 89.1% |
| Immigrants | Chile | 14.4 /100 | #208 | Poor 89.1% |
| Immigrants | Italy | 14.0 /100 | #209 | Poor 89.1% |
| Dutch West Indians | 13.5 /100 | #210 | Poor 89.0% |
| Sierra Leoneans | 13.0 /100 | #211 | Poor 89.0% |
| Somalis | 12.8 /100 | #212 | Poor 89.0% |
| Immigrants | Western Asia | 12.3 /100 | #213 | Poor 89.0% |
| Immigrants | Hungary | 11.9 /100 | #214 | Poor 89.0% |
| Immigrants | Sri Lanka | 10.2 /100 | #215 | Poor 88.9% |
| Immigrants | Argentina | 9.4 /100 | #216 | Tragic 88.9% |
| Argentineans | 8.8 /100 | #217 | Tragic 88.9% |
| Ugandans | 8.7 /100 | #218 | Tragic 88.9% |
| Immigrants | Guatemala | 8.6 /100 | #219 | Tragic 88.9% |
| Immigrants | Zaire | 8.1 /100 | #220 | Tragic 88.8% |
| Peruvians | 7.9 /100 | #221 | Tragic 88.8% |