Creek vs Immigrants from Hungary Male Unemployment
COMPARE
Creek
Immigrants from Hungary
Male Unemployment
Male Unemployment Comparison
Creek
Immigrants from Hungary
5.6%
MALE UNEMPLOYMENT
2.6/ 100
METRIC RATING
223rd/ 347
METRIC RANK
5.2%
MALE UNEMPLOYMENT
73.4/ 100
METRIC RATING
155th/ 347
METRIC RANK
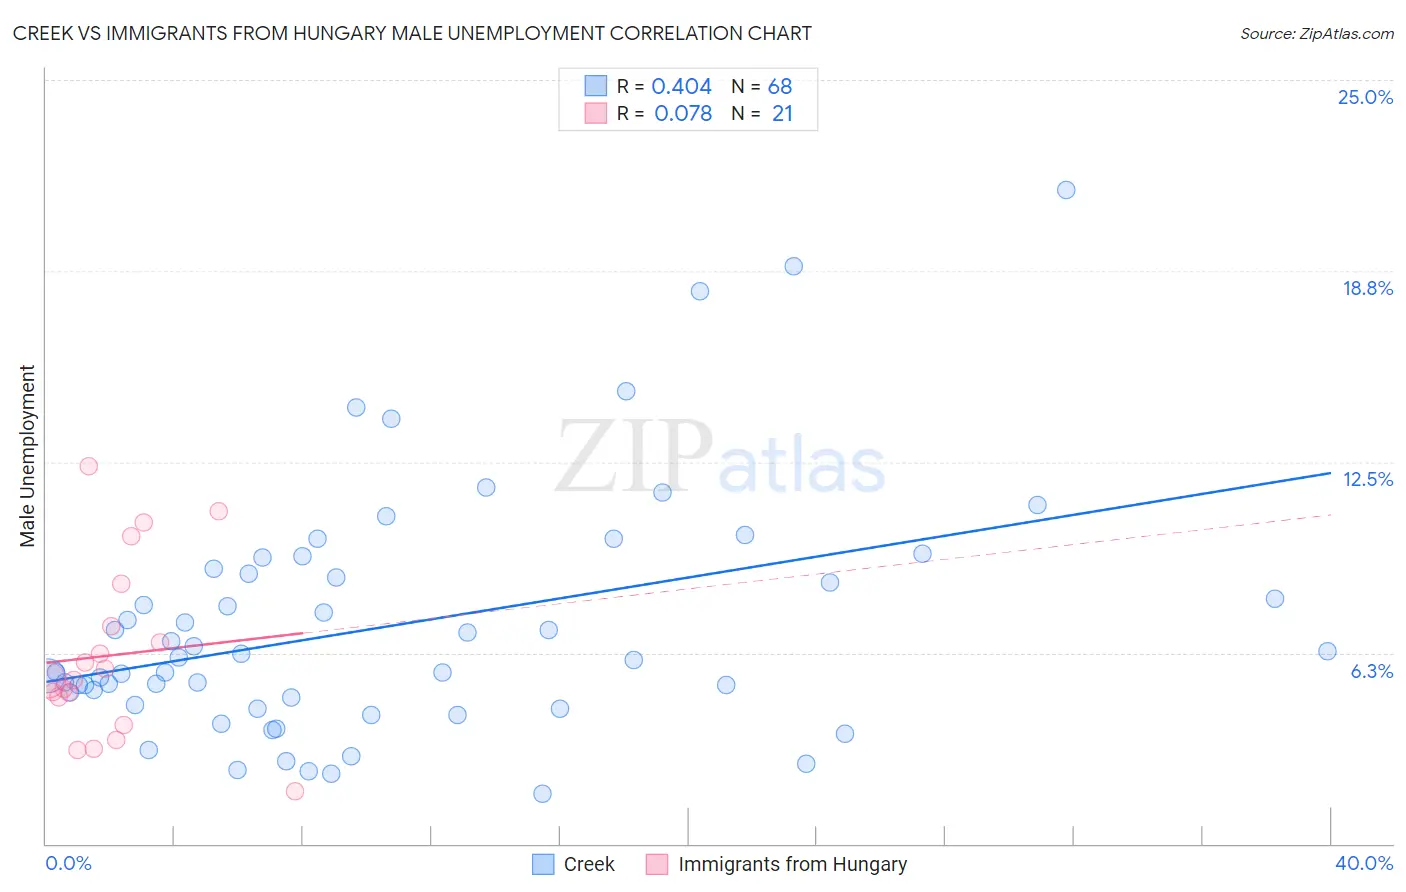
Creek vs Immigrants from Hungary Male Unemployment Correlation Chart
The statistical analysis conducted on geographies consisting of 177,831,732 people shows a moderate positive correlation between the proportion of Creek and unemployment rate among males in the United States with a correlation coefficient (R) of 0.404 and weighted average of 5.6%. Similarly, the statistical analysis conducted on geographies consisting of 195,412,330 people shows a slight positive correlation between the proportion of Immigrants from Hungary and unemployment rate among males in the United States with a correlation coefficient (R) of 0.078 and weighted average of 5.2%, a difference of 6.9%.
Male Unemployment Correlation Summary
| Measurement | Creek | Immigrants from Hungary |
| Minimum | 1.6% | 1.7% |
| Maximum | 21.4% | 12.3% |
| Range | 19.8% | 10.6% |
| Mean | 7.1% | 6.2% |
| Median | 6.1% | 5.4% |
| Interquartile 25% (IQ1) | 4.7% | 4.4% |
| Interquartile 75% (IQ3) | 8.9% | 7.8% |
| Interquartile Range (IQR) | 4.3% | 3.5% |
| Standard Deviation (Sample) | 4.0% | 2.8% |
| Standard Deviation (Population) | 3.9% | 2.8% |
Similar Demographics by Male Unemployment
Demographics Similar to Creek by Male Unemployment
In terms of male unemployment, the demographic groups most similar to Creek are Cherokee (5.6%, a difference of 0.13%), Immigrants from Micronesia (5.6%, a difference of 0.15%), Soviet Union (5.6%, a difference of 0.29%), Portuguese (5.6%, a difference of 0.40%), and Immigrants from Western Asia (5.6%, a difference of 0.42%).
| Demographics | Rating | Rank | Male Unemployment |
| Immigrants | Immigrants | 4.3 /100 | #216 | Tragic 5.5% |
| Delaware | 4.2 /100 | #217 | Tragic 5.5% |
| Immigrants | Albania | 3.6 /100 | #218 | Tragic 5.5% |
| Immigrants | Western Asia | 3.5 /100 | #219 | Tragic 5.6% |
| Portuguese | 3.5 /100 | #220 | Tragic 5.6% |
| Soviet Union | 3.2 /100 | #221 | Tragic 5.6% |
| Immigrants | Micronesia | 2.9 /100 | #222 | Tragic 5.6% |
| Creek | 2.6 /100 | #223 | Tragic 5.6% |
| Cherokee | 2.4 /100 | #224 | Tragic 5.6% |
| Panamanians | 1.9 /100 | #225 | Tragic 5.6% |
| Immigrants | Cambodia | 1.8 /100 | #226 | Tragic 5.6% |
| Immigrants | Panama | 1.8 /100 | #227 | Tragic 5.6% |
| Seminole | 1.8 /100 | #228 | Tragic 5.6% |
| Central Americans | 1.8 /100 | #229 | Tragic 5.6% |
| Immigrants | Africa | 1.7 /100 | #230 | Tragic 5.6% |
Demographics Similar to Immigrants from Hungary by Male Unemployment
In terms of male unemployment, the demographic groups most similar to Immigrants from Hungary are Laotian (5.2%, a difference of 0.030%), Immigrants from Uruguay (5.2%, a difference of 0.040%), American (5.2%, a difference of 0.060%), Immigrants from Northern Africa (5.2%, a difference of 0.080%), and Egyptian (5.2%, a difference of 0.11%).
| Demographics | Rating | Rank | Male Unemployment |
| Immigrants | Italy | 76.3 /100 | #148 | Good 5.2% |
| Immigrants | Europe | 76.2 /100 | #149 | Good 5.2% |
| Indians (Asian) | 76.0 /100 | #150 | Good 5.2% |
| Slovaks | 75.5 /100 | #151 | Good 5.2% |
| Egyptians | 74.8 /100 | #152 | Good 5.2% |
| Immigrants | Uruguay | 73.9 /100 | #153 | Good 5.2% |
| Laotians | 73.8 /100 | #154 | Good 5.2% |
| Immigrants | Hungary | 73.4 /100 | #155 | Good 5.2% |
| Americans | 72.7 /100 | #156 | Good 5.2% |
| Immigrants | Northern Africa | 72.3 /100 | #157 | Good 5.2% |
| Immigrants | Indonesia | 71.5 /100 | #158 | Good 5.2% |
| Indonesians | 71.2 /100 | #159 | Good 5.2% |
| Immigrants | Norway | 71.0 /100 | #160 | Good 5.2% |
| Immigrants | China | 70.6 /100 | #161 | Good 5.2% |
| Immigrants | Egypt | 65.9 /100 | #162 | Good 5.2% |