Creek vs Immigrants from Hungary Female Poverty Among 18-24 Year Olds
COMPARE
Creek
Immigrants from Hungary
Female Poverty Among 18-24 Year Olds
Female Poverty Among 18-24 Year Olds Comparison
Creek
Immigrants from Hungary
24.2%
FEMALE POVERTY AMONG 18-24 YEAR OLDS
0.0/ 100
METRIC RATING
313th/ 347
METRIC RANK
19.3%
FEMALE POVERTY AMONG 18-24 YEAR OLDS
96.2/ 100
METRIC RATING
115th/ 347
METRIC RANK
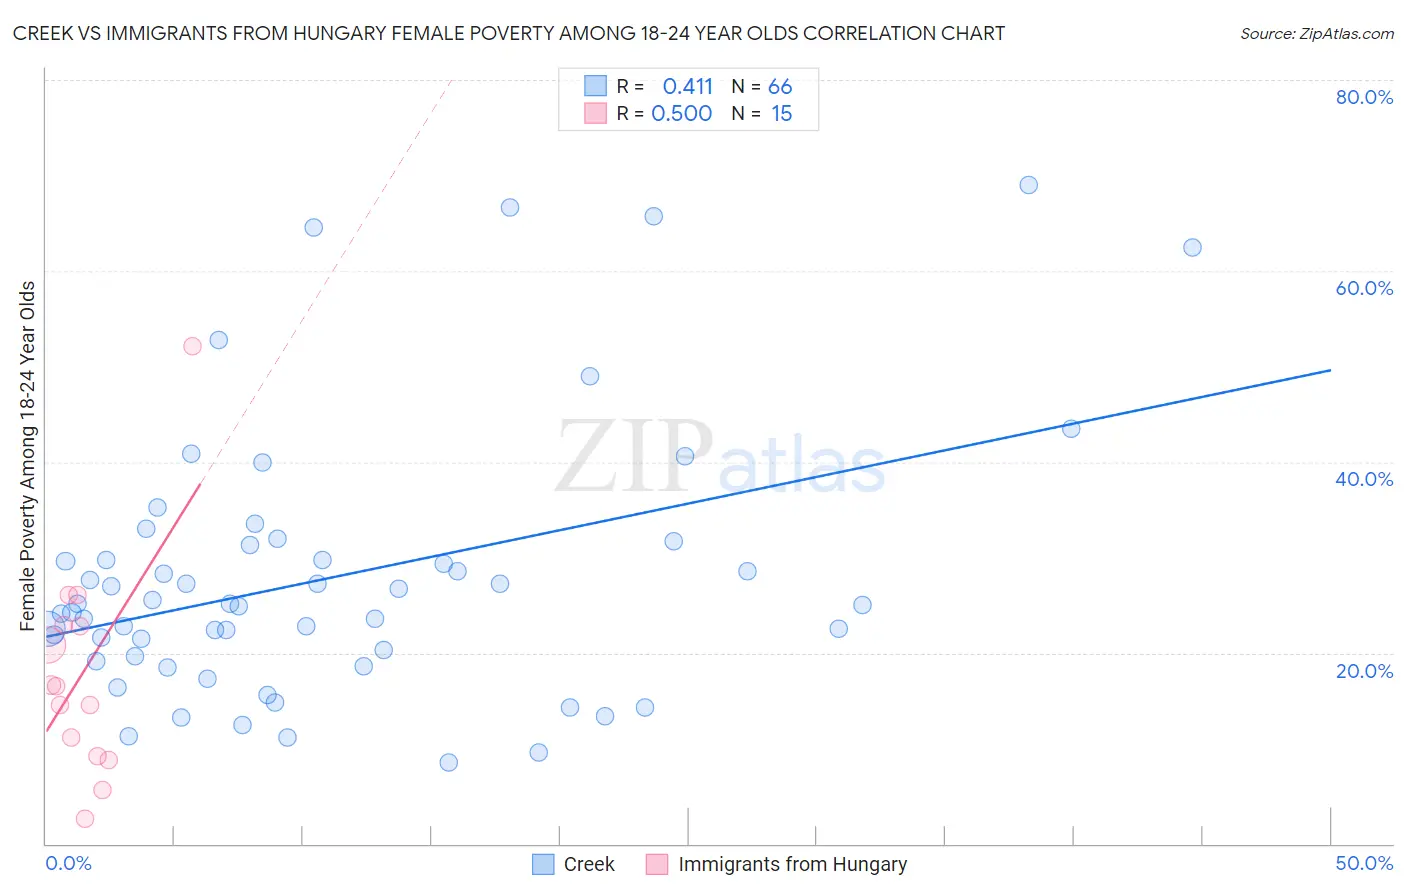
Creek vs Immigrants from Hungary Female Poverty Among 18-24 Year Olds Correlation Chart
The statistical analysis conducted on geographies consisting of 176,646,944 people shows a moderate positive correlation between the proportion of Creek and poverty level among females between the ages 18 and 24 in the United States with a correlation coefficient (R) of 0.411 and weighted average of 24.2%. Similarly, the statistical analysis conducted on geographies consisting of 192,436,137 people shows a moderate positive correlation between the proportion of Immigrants from Hungary and poverty level among females between the ages 18 and 24 in the United States with a correlation coefficient (R) of 0.500 and weighted average of 19.3%, a difference of 25.5%.
Female Poverty Among 18-24 Year Olds Correlation Summary
| Measurement | Creek | Immigrants from Hungary |
| Minimum | 8.5% | 2.6% |
| Maximum | 69.0% | 52.2% |
| Range | 60.4% | 49.6% |
| Mean | 28.0% | 18.0% |
| Median | 25.1% | 16.5% |
| Interquartile 25% (IQ1) | 19.7% | 9.2% |
| Interquartile 75% (IQ3) | 31.3% | 23.0% |
| Interquartile Range (IQR) | 11.7% | 13.7% |
| Standard Deviation (Sample) | 14.0% | 11.9% |
| Standard Deviation (Population) | 13.9% | 11.5% |
Similar Demographics by Female Poverty Among 18-24 Year Olds
Demographics Similar to Creek by Female Poverty Among 18-24 Year Olds
In terms of female poverty among 18-24 year olds, the demographic groups most similar to Creek are Choctaw (24.3%, a difference of 0.16%), Black/African American (24.3%, a difference of 0.36%), Alsatian (24.4%, a difference of 0.67%), Osage (24.5%, a difference of 0.97%), and Chickasaw (24.5%, a difference of 1.1%).
| Demographics | Rating | Rank | Female Poverty Among 18-24 Year Olds |
| Paiute | 0.0 /100 | #306 | Tragic 23.3% |
| Cree | 0.0 /100 | #307 | Tragic 23.4% |
| Immigrants | Sudan | 0.0 /100 | #308 | Tragic 23.5% |
| Blackfeet | 0.0 /100 | #309 | Tragic 23.6% |
| Comanche | 0.0 /100 | #310 | Tragic 23.6% |
| Potawatomi | 0.0 /100 | #311 | Tragic 23.7% |
| Yuman | 0.0 /100 | #312 | Tragic 24.0% |
| Creek | 0.0 /100 | #313 | Tragic 24.2% |
| Choctaw | 0.0 /100 | #314 | Tragic 24.3% |
| Blacks/African Americans | 0.0 /100 | #315 | Tragic 24.3% |
| Alsatians | 0.0 /100 | #316 | Tragic 24.4% |
| Osage | 0.0 /100 | #317 | Tragic 24.5% |
| Chickasaw | 0.0 /100 | #318 | Tragic 24.5% |
| Dutch West Indians | 0.0 /100 | #319 | Tragic 24.5% |
| Immigrants | Congo | 0.0 /100 | #320 | Tragic 24.6% |
Demographics Similar to Immigrants from Hungary by Female Poverty Among 18-24 Year Olds
In terms of female poverty among 18-24 year olds, the demographic groups most similar to Immigrants from Hungary are Slovene (19.3%, a difference of 0.010%), Immigrants from Cameroon (19.3%, a difference of 0.050%), Immigrants (19.3%, a difference of 0.10%), Immigrants from El Salvador (19.3%, a difference of 0.11%), and Immigrants from Iran (19.3%, a difference of 0.14%).
| Demographics | Rating | Rank | Female Poverty Among 18-24 Year Olds |
| Immigrants | Uzbekistan | 97.3 /100 | #108 | Exceptional 19.2% |
| Immigrants | Syria | 97.2 /100 | #109 | Exceptional 19.2% |
| Laotians | 97.1 /100 | #110 | Exceptional 19.2% |
| Immigrants | Serbia | 97.1 /100 | #111 | Exceptional 19.2% |
| Immigrants | El Salvador | 96.5 /100 | #112 | Exceptional 19.3% |
| Immigrants | Cameroon | 96.3 /100 | #113 | Exceptional 19.3% |
| Slovenes | 96.2 /100 | #114 | Exceptional 19.3% |
| Immigrants | Hungary | 96.2 /100 | #115 | Exceptional 19.3% |
| Immigrants | Immigrants | 95.9 /100 | #116 | Exceptional 19.3% |
| Immigrants | Iran | 95.8 /100 | #117 | Exceptional 19.3% |
| Immigrants | Guyana | 95.6 /100 | #118 | Exceptional 19.3% |
| Cypriots | 95.5 /100 | #119 | Exceptional 19.3% |
| Immigrants | Northern Europe | 95.4 /100 | #120 | Exceptional 19.4% |
| Guyanese | 95.3 /100 | #121 | Exceptional 19.4% |
| Cambodians | 94.6 /100 | #122 | Exceptional 19.4% |