Creek vs Venezuelan 1 or more Vehicles in Household
COMPARE
Creek
Venezuelan
1 or more Vehicles in Household
1 or more Vehicles in Household Comparison
Creek
Venezuelans
92.3%
1 OR MORE VEHICLES IN HOUSEHOLD
99.9/ 100
METRIC RATING
40th/ 347
METRIC RANK
91.9%
1 OR MORE VEHICLES IN HOUSEHOLD
99.8/ 100
METRIC RATING
59th/ 347
METRIC RANK
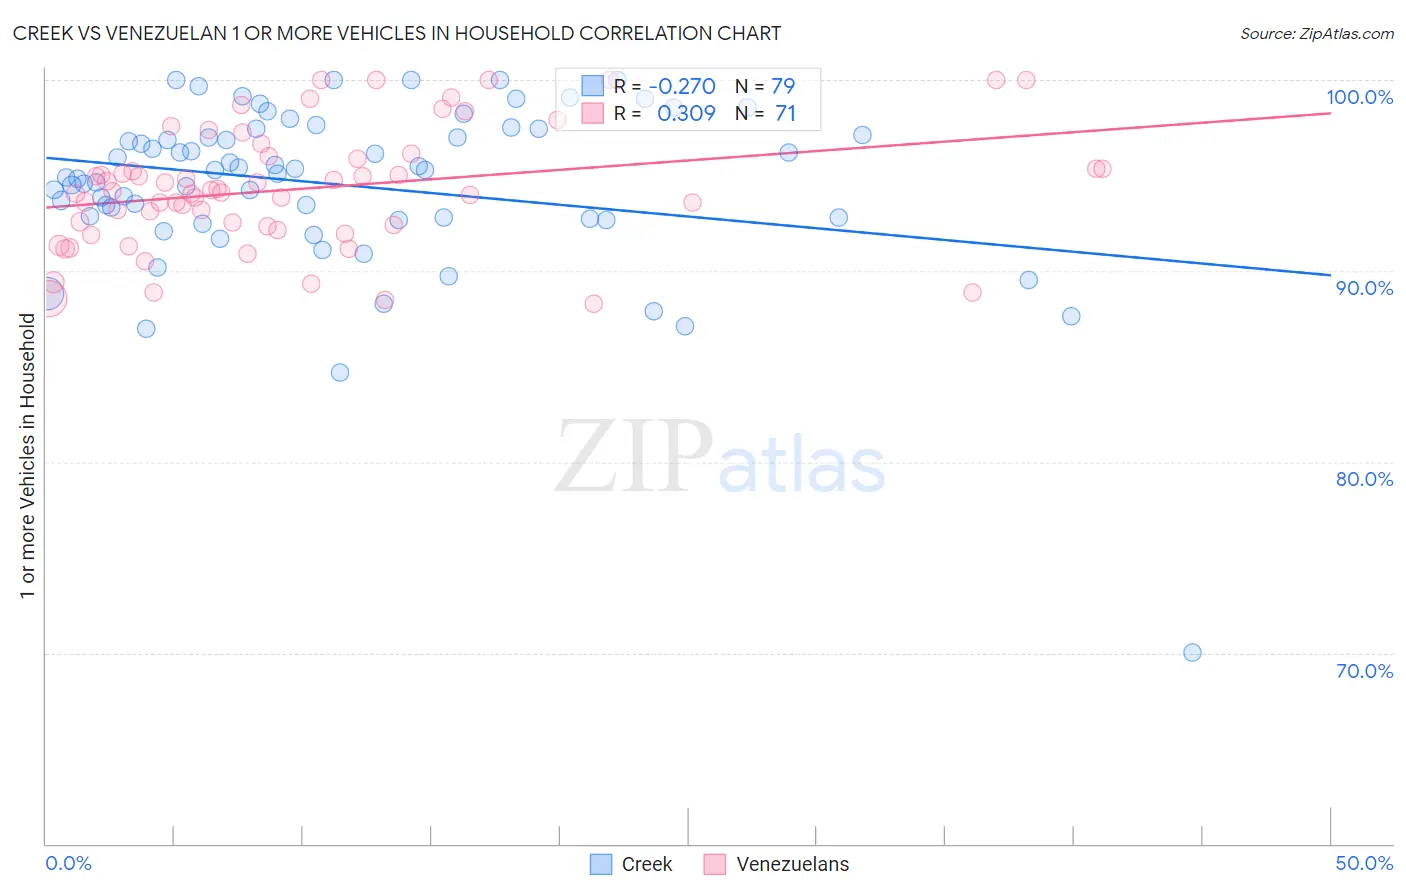
Creek vs Venezuelan 1 or more Vehicles in Household Correlation Chart
The statistical analysis conducted on geographies consisting of 178,443,549 people shows a weak negative correlation between the proportion of Creek and percentage of households with 1 or more vehicles available in the United States with a correlation coefficient (R) of -0.270 and weighted average of 92.3%. Similarly, the statistical analysis conducted on geographies consisting of 306,174,989 people shows a mild positive correlation between the proportion of Venezuelans and percentage of households with 1 or more vehicles available in the United States with a correlation coefficient (R) of 0.309 and weighted average of 91.9%, a difference of 0.41%.
1 or more Vehicles in Household Correlation Summary
| Measurement | Creek | Venezuelan |
| Minimum | 70.0% | 88.3% |
| Maximum | 100.0% | 100.0% |
| Range | 30.0% | 11.7% |
| Mean | 94.5% | 94.3% |
| Median | 95.3% | 94.2% |
| Interquartile 25% (IQ1) | 92.7% | 92.3% |
| Interquartile 75% (IQ3) | 97.4% | 96.0% |
| Interquartile Range (IQR) | 4.7% | 3.7% |
| Standard Deviation (Sample) | 4.5% | 3.1% |
| Standard Deviation (Population) | 4.4% | 3.1% |
Demographics Similar to Creek and Venezuelans by 1 or more Vehicles in Household
In terms of 1 or more vehicles in household, the demographic groups most similar to Creek are Swiss (92.3%, a difference of 0.0%), Immigrants from Taiwan (92.3%, a difference of 0.020%), Chickasaw (92.3%, a difference of 0.030%), Spanish (92.3%, a difference of 0.030%), and Choctaw (92.2%, a difference of 0.050%). Similarly, the demographic groups most similar to Venezuelans are Immigrants from Mexico (91.9%, a difference of 0.010%), Iraqi (91.9%, a difference of 0.030%), Immigrants from Afghanistan (92.0%, a difference of 0.070%), Immigrants from Venezuela (92.0%, a difference of 0.070%), and Hawaiian (92.0%, a difference of 0.13%).
| Demographics | Rating | Rank | 1 or more Vehicles in Household |
| Swiss | 99.9 /100 | #39 | Exceptional 92.3% |
| Creek | 99.9 /100 | #40 | Exceptional 92.3% |
| Immigrants | Taiwan | 99.9 /100 | #41 | Exceptional 92.3% |
| Chickasaw | 99.9 /100 | #42 | Exceptional 92.3% |
| Spanish | 99.9 /100 | #43 | Exceptional 92.3% |
| Choctaw | 99.9 /100 | #44 | Exceptional 92.2% |
| Immigrants | Nonimmigrants | 99.9 /100 | #45 | Exceptional 92.2% |
| Immigrants | Fiji | 99.9 /100 | #46 | Exceptional 92.2% |
| Northern Europeans | 99.9 /100 | #47 | Exceptional 92.2% |
| Belgians | 99.9 /100 | #48 | Exceptional 92.1% |
| Afghans | 99.9 /100 | #49 | Exceptional 92.1% |
| Guamanians/Chamorros | 99.9 /100 | #50 | Exceptional 92.1% |
| Celtics | 99.9 /100 | #51 | Exceptional 92.1% |
| Koreans | 99.9 /100 | #52 | Exceptional 92.1% |
| Hawaiians | 99.9 /100 | #53 | Exceptional 92.0% |
| Slovenes | 99.9 /100 | #54 | Exceptional 92.0% |
| Immigrants | Afghanistan | 99.9 /100 | #55 | Exceptional 92.0% |
| Immigrants | Venezuela | 99.9 /100 | #56 | Exceptional 92.0% |
| Iraqis | 99.8 /100 | #57 | Exceptional 91.9% |
| Immigrants | Mexico | 99.8 /100 | #58 | Exceptional 91.9% |
| Venezuelans | 99.8 /100 | #59 | Exceptional 91.9% |