Guatemalan vs Immigrants from Hungary 1 or more Vehicles in Household
COMPARE
Guatemalan
Immigrants from Hungary
1 or more Vehicles in Household
1 or more Vehicles in Household Comparison
Guatemalans
Immigrants from Hungary
89.2%
1 OR MORE VEHICLES IN HOUSEHOLD
17.8/ 100
METRIC RATING
205th/ 347
METRIC RANK
89.0%
1 OR MORE VEHICLES IN HOUSEHOLD
11.9/ 100
METRIC RATING
214th/ 347
METRIC RANK
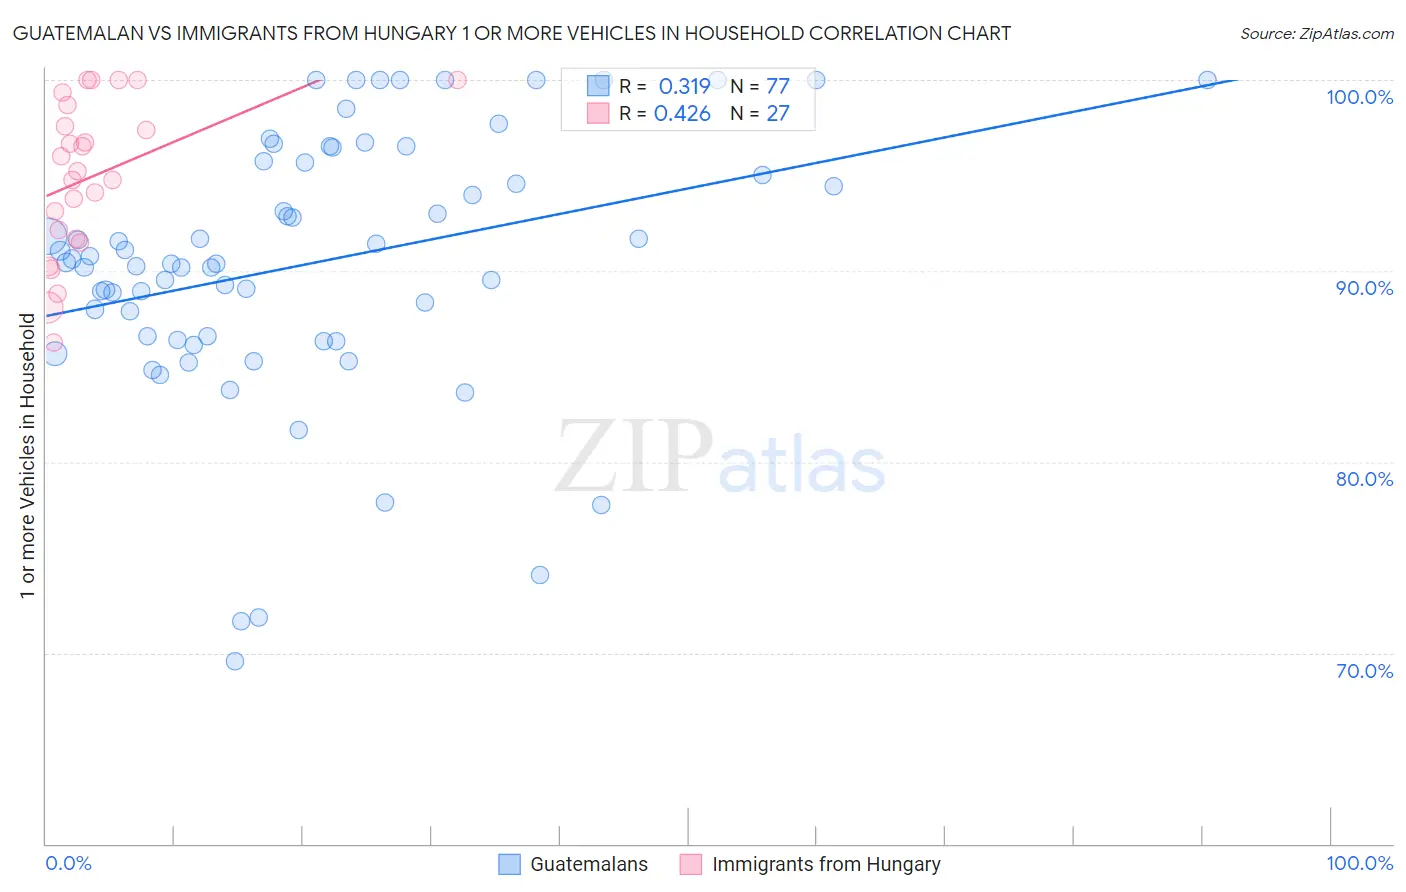
Guatemalan vs Immigrants from Hungary 1 or more Vehicles in Household Correlation Chart
The statistical analysis conducted on geographies consisting of 409,296,484 people shows a mild positive correlation between the proportion of Guatemalans and percentage of households with 1 or more vehicles available in the United States with a correlation coefficient (R) of 0.319 and weighted average of 89.2%. Similarly, the statistical analysis conducted on geographies consisting of 195,676,592 people shows a moderate positive correlation between the proportion of Immigrants from Hungary and percentage of households with 1 or more vehicles available in the United States with a correlation coefficient (R) of 0.426 and weighted average of 89.0%, a difference of 0.19%.
1 or more Vehicles in Household Correlation Summary
| Measurement | Guatemalan | Immigrants from Hungary |
| Minimum | 69.6% | 86.3% |
| Maximum | 100.0% | 100.0% |
| Range | 30.4% | 13.7% |
| Mean | 90.4% | 94.9% |
| Median | 90.4% | 95.3% |
| Interquartile 25% (IQ1) | 86.5% | 91.7% |
| Interquartile 75% (IQ3) | 95.7% | 98.7% |
| Interquartile Range (IQR) | 9.3% | 7.0% |
| Standard Deviation (Sample) | 6.9% | 4.0% |
| Standard Deviation (Population) | 6.8% | 4.0% |
Demographics Similar to Guatemalans and Immigrants from Hungary by 1 or more Vehicles in Household
In terms of 1 or more vehicles in household, the demographic groups most similar to Guatemalans are Romanian (89.2%, a difference of 0.010%), Cambodian (89.2%, a difference of 0.030%), Iroquois (89.2%, a difference of 0.050%), Apache (89.1%, a difference of 0.050%), and Immigrants from Western Europe (89.2%, a difference of 0.070%). Similarly, the demographic groups most similar to Immigrants from Hungary are Immigrants from Western Asia (89.0%, a difference of 0.010%), Somali (89.0%, a difference of 0.030%), Sierra Leonean (89.0%, a difference of 0.040%), Dutch West Indian (89.0%, a difference of 0.060%), and Immigrants from Italy (89.1%, a difference of 0.070%).
| Demographics | Rating | Rank | 1 or more Vehicles in Household |
| Immigrants | Asia | 22.8 /100 | #199 | Fair 89.3% |
| Central Americans | 21.4 /100 | #200 | Fair 89.2% |
| Immigrants | Western Europe | 20.5 /100 | #201 | Fair 89.2% |
| Iroquois | 19.8 /100 | #202 | Poor 89.2% |
| Cambodians | 18.9 /100 | #203 | Poor 89.2% |
| Romanians | 18.2 /100 | #204 | Poor 89.2% |
| Guatemalans | 17.8 /100 | #205 | Poor 89.2% |
| Apache | 16.2 /100 | #206 | Poor 89.1% |
| Immigrants | Denmark | 14.8 /100 | #207 | Poor 89.1% |
| Immigrants | Chile | 14.4 /100 | #208 | Poor 89.1% |
| Immigrants | Italy | 14.0 /100 | #209 | Poor 89.1% |
| Dutch West Indians | 13.5 /100 | #210 | Poor 89.0% |
| Sierra Leoneans | 13.0 /100 | #211 | Poor 89.0% |
| Somalis | 12.8 /100 | #212 | Poor 89.0% |
| Immigrants | Western Asia | 12.3 /100 | #213 | Poor 89.0% |
| Immigrants | Hungary | 11.9 /100 | #214 | Poor 89.0% |
| Immigrants | Sri Lanka | 10.2 /100 | #215 | Poor 88.9% |
| Immigrants | Argentina | 9.4 /100 | #216 | Tragic 88.9% |
| Argentineans | 8.8 /100 | #217 | Tragic 88.9% |
| Ugandans | 8.7 /100 | #218 | Tragic 88.9% |
| Immigrants | Guatemala | 8.6 /100 | #219 | Tragic 88.9% |