Creek vs Immigrants from Hungary Male Poverty
COMPARE
Creek
Immigrants from Hungary
Male Poverty
Male Poverty Comparison
Creek
Immigrants from Hungary
14.1%
MALE POVERTY
0.0/ 100
METRIC RATING
306th/ 347
METRIC RANK
10.7%
MALE POVERTY
87.6/ 100
METRIC RATING
119th/ 347
METRIC RANK
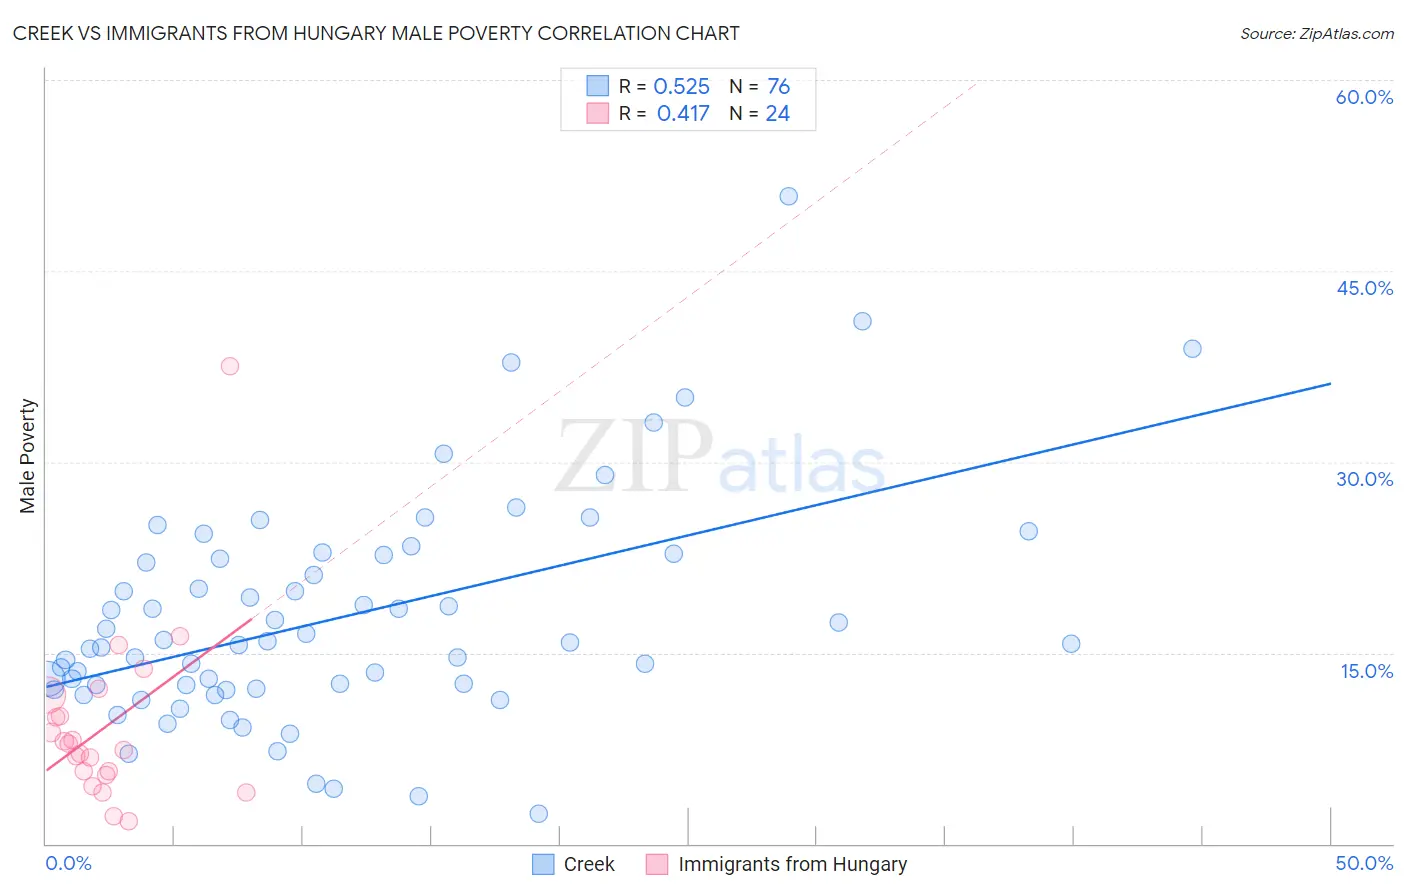
Creek vs Immigrants from Hungary Male Poverty Correlation Chart
The statistical analysis conducted on geographies consisting of 178,404,623 people shows a substantial positive correlation between the proportion of Creek and poverty level among males in the United States with a correlation coefficient (R) of 0.525 and weighted average of 14.1%. Similarly, the statistical analysis conducted on geographies consisting of 195,630,615 people shows a moderate positive correlation between the proportion of Immigrants from Hungary and poverty level among males in the United States with a correlation coefficient (R) of 0.417 and weighted average of 10.7%, a difference of 32.5%.
Male Poverty Correlation Summary
| Measurement | Creek | Immigrants from Hungary |
| Minimum | 2.3% | 1.8% |
| Maximum | 50.8% | 37.5% |
| Range | 48.5% | 35.8% |
| Mean | 17.8% | 9.2% |
| Median | 15.7% | 7.6% |
| Interquartile 25% (IQ1) | 12.3% | 5.6% |
| Interquartile 75% (IQ3) | 22.5% | 10.9% |
| Interquartile Range (IQR) | 10.2% | 5.3% |
| Standard Deviation (Sample) | 8.9% | 7.1% |
| Standard Deviation (Population) | 8.8% | 7.0% |
Similar Demographics by Male Poverty
Demographics Similar to Creek by Male Poverty
In terms of male poverty, the demographic groups most similar to Creek are Immigrants from Bangladesh (14.1%, a difference of 0.070%), Senegalese (14.1%, a difference of 0.29%), Bahamian (14.1%, a difference of 0.39%), Immigrants from Caribbean (14.0%, a difference of 0.43%), and Immigrants from Senegal (14.0%, a difference of 0.49%).
| Demographics | Rating | Rank | Male Poverty |
| Immigrants | Guatemala | 0.0 /100 | #299 | Tragic 14.0% |
| Immigrants | Mexico | 0.0 /100 | #300 | Tragic 14.0% |
| Immigrants | Senegal | 0.0 /100 | #301 | Tragic 14.0% |
| Immigrants | Caribbean | 0.0 /100 | #302 | Tragic 14.0% |
| Bahamians | 0.0 /100 | #303 | Tragic 14.1% |
| Senegalese | 0.0 /100 | #304 | Tragic 14.1% |
| Immigrants | Bangladesh | 0.0 /100 | #305 | Tragic 14.1% |
| Creek | 0.0 /100 | #306 | Tragic 14.1% |
| Dutch West Indians | 0.0 /100 | #307 | Tragic 14.2% |
| Africans | 0.0 /100 | #308 | Tragic 14.2% |
| Somalis | 0.0 /100 | #309 | Tragic 14.3% |
| Seminole | 0.0 /100 | #310 | Tragic 14.3% |
| Hondurans | 0.0 /100 | #311 | Tragic 14.3% |
| Choctaw | 0.0 /100 | #312 | Tragic 14.4% |
| Immigrants | Somalia | 0.0 /100 | #313 | Tragic 14.6% |
Demographics Similar to Immigrants from Hungary by Male Poverty
In terms of male poverty, the demographic groups most similar to Immigrants from Hungary are Okinawan (10.7%, a difference of 0.010%), Immigrants from China (10.7%, a difference of 0.10%), Peruvian (10.7%, a difference of 0.11%), Immigrants from South Eastern Asia (10.6%, a difference of 0.12%), and Sri Lankan (10.6%, a difference of 0.13%).
| Demographics | Rating | Rank | Male Poverty |
| Immigrants | Turkey | 89.5 /100 | #112 | Excellent 10.6% |
| Palestinians | 89.1 /100 | #113 | Excellent 10.6% |
| Immigrants | Brazil | 89.0 /100 | #114 | Excellent 10.6% |
| Immigrants | Russia | 88.6 /100 | #115 | Excellent 10.6% |
| Sri Lankans | 88.1 /100 | #116 | Excellent 10.6% |
| Immigrants | South Eastern Asia | 88.1 /100 | #117 | Excellent 10.6% |
| Okinawans | 87.6 /100 | #118 | Excellent 10.7% |
| Immigrants | Hungary | 87.6 /100 | #119 | Excellent 10.7% |
| Immigrants | China | 87.1 /100 | #120 | Excellent 10.7% |
| Peruvians | 87.1 /100 | #121 | Excellent 10.7% |
| Native Hawaiians | 87.0 /100 | #122 | Excellent 10.7% |
| South Africans | 86.8 /100 | #123 | Excellent 10.7% |
| French | 86.7 /100 | #124 | Excellent 10.7% |
| Immigrants | Norway | 86.0 /100 | #125 | Excellent 10.7% |
| Immigrants | Ukraine | 84.3 /100 | #126 | Excellent 10.7% |