Choctaw vs Immigrants from Peru Married-couple Households
COMPARE
Choctaw
Immigrants from Peru
Married-couple Households
Married-couple Households Comparison
Choctaw
Immigrants from Peru
46.0%
MARRIED-COUPLE HOUSEHOLDS
24.9/ 100
METRIC RATING
191st/ 347
METRIC RANK
47.3%
MARRIED-COUPLE HOUSEHOLDS
87.9/ 100
METRIC RATING
128th/ 347
METRIC RANK
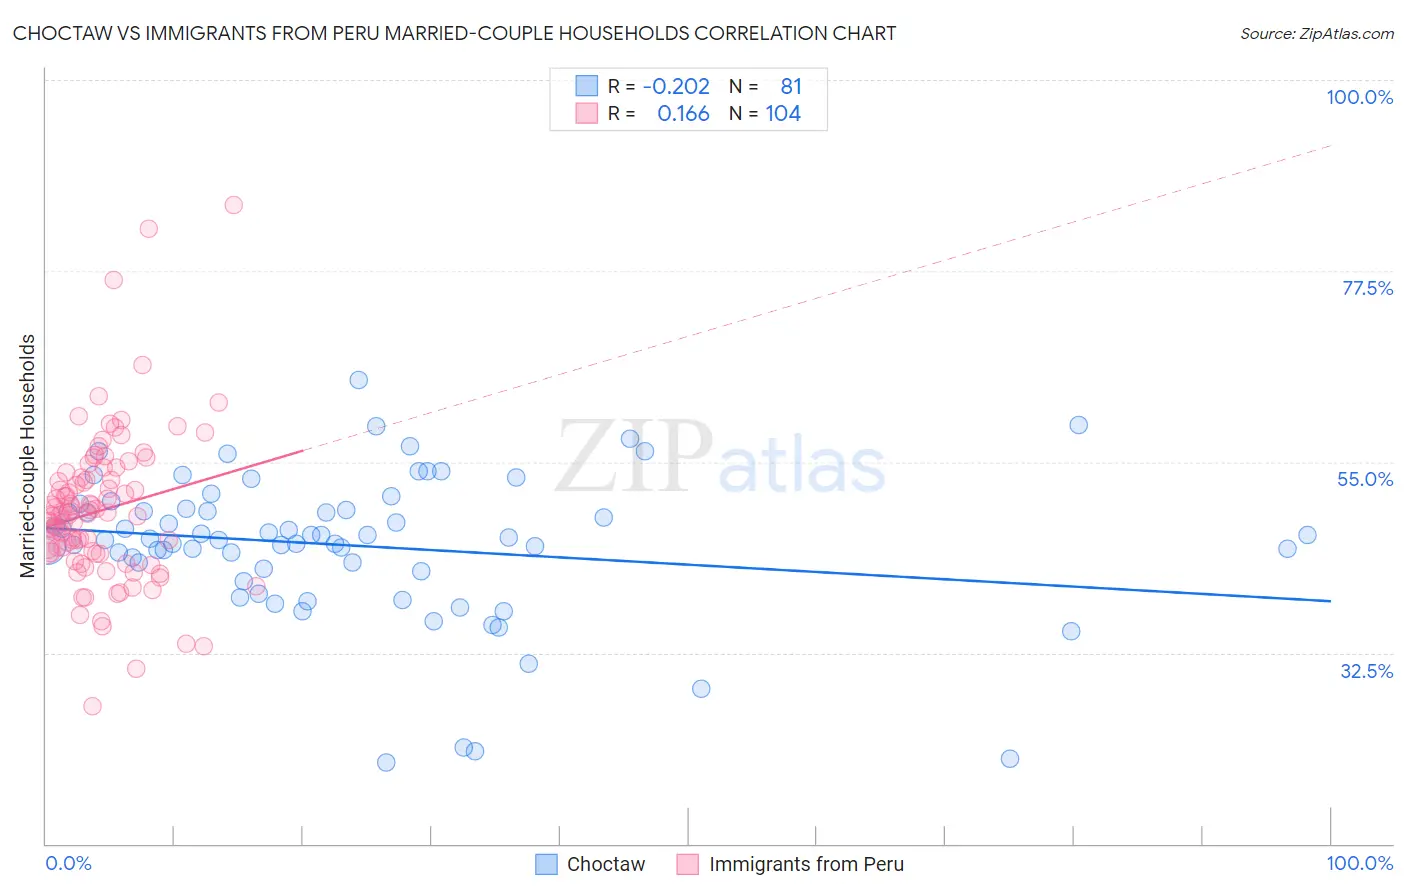
Choctaw vs Immigrants from Peru Married-couple Households Correlation Chart
The statistical analysis conducted on geographies consisting of 269,626,199 people shows a weak negative correlation between the proportion of Choctaw and percentage of married-couple family households in the United States with a correlation coefficient (R) of -0.202 and weighted average of 46.0%. Similarly, the statistical analysis conducted on geographies consisting of 328,750,630 people shows a poor positive correlation between the proportion of Immigrants from Peru and percentage of married-couple family households in the United States with a correlation coefficient (R) of 0.166 and weighted average of 47.3%, a difference of 2.9%.
Married-couple Households Correlation Summary
| Measurement | Choctaw | Immigrants from Peru |
| Minimum | 19.5% | 26.2% |
| Maximum | 64.6% | 85.3% |
| Range | 45.1% | 59.1% |
| Mean | 45.2% | 49.2% |
| Median | 45.9% | 48.9% |
| Interquartile 25% (IQ1) | 42.3% | 44.3% |
| Interquartile 75% (IQ3) | 49.4% | 53.0% |
| Interquartile Range (IQR) | 7.1% | 8.7% |
| Standard Deviation (Sample) | 8.6% | 9.0% |
| Standard Deviation (Population) | 8.6% | 9.0% |
Similar Demographics by Married-couple Households
Demographics Similar to Choctaw by Married-couple Households
In terms of married-couple households, the demographic groups most similar to Choctaw are Immigrants from Northern Africa (46.0%, a difference of 0.020%), Immigrants from Kuwait (46.0%, a difference of 0.030%), Taiwanese (45.9%, a difference of 0.080%), Mexican American Indian (45.9%, a difference of 0.080%), and Immigrants from Latvia (46.0%, a difference of 0.10%).
| Demographics | Rating | Rank | Married-couple Households |
| Immigrants | Switzerland | 36.9 /100 | #184 | Fair 46.2% |
| Brazilians | 35.9 /100 | #185 | Fair 46.2% |
| Albanians | 31.1 /100 | #186 | Fair 46.1% |
| Fijians | 29.2 /100 | #187 | Fair 46.1% |
| South American Indians | 28.4 /100 | #188 | Fair 46.0% |
| Immigrants | Latvia | 26.9 /100 | #189 | Fair 46.0% |
| Immigrants | Kuwait | 25.6 /100 | #190 | Fair 46.0% |
| Choctaw | 24.9 /100 | #191 | Fair 46.0% |
| Immigrants | Northern Africa | 24.6 /100 | #192 | Fair 46.0% |
| Taiwanese | 23.4 /100 | #193 | Fair 45.9% |
| Mexican American Indians | 23.3 /100 | #194 | Fair 45.9% |
| Chickasaw | 22.7 /100 | #195 | Fair 45.9% |
| Immigrants | South America | 22.2 /100 | #196 | Fair 45.9% |
| Cambodians | 21.3 /100 | #197 | Fair 45.9% |
| Ottawa | 19.4 /100 | #198 | Poor 45.8% |
Demographics Similar to Immigrants from Peru by Married-couple Households
In terms of married-couple households, the demographic groups most similar to Immigrants from Peru are Immigrants from Iraq (47.3%, a difference of 0.010%), Immigrants from Hungary (47.3%, a difference of 0.010%), Celtic (47.3%, a difference of 0.020%), Immigrants from Denmark (47.3%, a difference of 0.030%), and Pakistani (47.3%, a difference of 0.070%).
| Demographics | Rating | Rank | Married-couple Households |
| Immigrants | Eastern Europe | 90.3 /100 | #121 | Exceptional 47.4% |
| Okinawans | 90.1 /100 | #122 | Exceptional 47.4% |
| Immigrants | Venezuela | 89.3 /100 | #123 | Excellent 47.4% |
| Zimbabweans | 89.2 /100 | #124 | Excellent 47.4% |
| Australians | 89.0 /100 | #125 | Excellent 47.4% |
| Pakistanis | 88.6 /100 | #126 | Excellent 47.3% |
| Celtics | 88.1 /100 | #127 | Excellent 47.3% |
| Immigrants | Peru | 87.9 /100 | #128 | Excellent 47.3% |
| Immigrants | Iraq | 87.8 /100 | #129 | Excellent 47.3% |
| Immigrants | Hungary | 87.8 /100 | #130 | Excellent 47.3% |
| Immigrants | Denmark | 87.5 /100 | #131 | Excellent 47.3% |
| Immigrants | Ukraine | 86.7 /100 | #132 | Excellent 47.3% |
| South Africans | 86.4 /100 | #133 | Excellent 47.3% |
| Immigrants | Greece | 86.0 /100 | #134 | Excellent 47.2% |
| Immigrants | Argentina | 86.0 /100 | #135 | Excellent 47.2% |