Choctaw vs Cherokee 2 or more Vehicles in Household
COMPARE
Choctaw
Cherokee
2 or more Vehicles in Household
2 or more Vehicles in Household Comparison
Choctaw
Cherokee
59.3%
2 OR MORE VEHICLES IN HOUSEHOLD
99.9/ 100
METRIC RATING
50th/ 347
METRIC RANK
59.9%
2 OR MORE VEHICLES IN HOUSEHOLD
100.0/ 100
METRIC RATING
40th/ 347
METRIC RANK
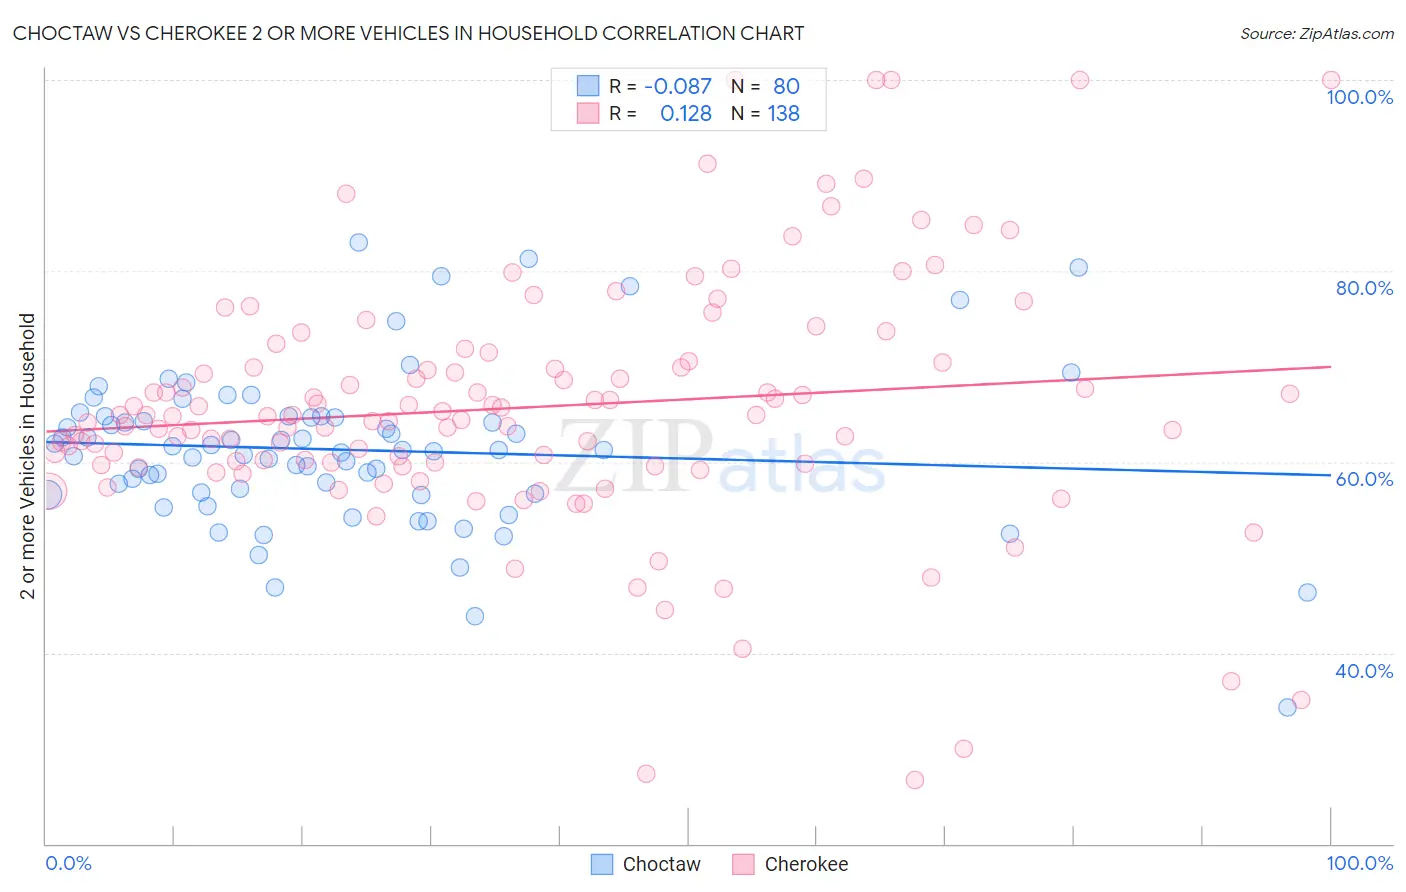
Choctaw vs Cherokee 2 or more Vehicles in Household Correlation Chart
The statistical analysis conducted on geographies consisting of 269,636,757 people shows a slight negative correlation between the proportion of Choctaw and percentage of households with 2 or more vehicles available in the United States with a correlation coefficient (R) of -0.087 and weighted average of 59.3%. Similarly, the statistical analysis conducted on geographies consisting of 493,419,390 people shows a poor positive correlation between the proportion of Cherokee and percentage of households with 2 or more vehicles available in the United States with a correlation coefficient (R) of 0.128 and weighted average of 59.9%, a difference of 1.0%.
2 or more Vehicles in Household Correlation Summary
| Measurement | Choctaw | Cherokee |
| Minimum | 34.2% | 26.7% |
| Maximum | 83.0% | 100.0% |
| Range | 48.7% | 73.3% |
| Mean | 61.3% | 65.7% |
| Median | 61.3% | 64.8% |
| Interquartile 25% (IQ1) | 56.7% | 59.8% |
| Interquartile 75% (IQ3) | 64.7% | 70.3% |
| Interquartile Range (IQR) | 8.0% | 10.6% |
| Standard Deviation (Sample) | 8.3% | 13.1% |
| Standard Deviation (Population) | 8.2% | 13.0% |
Demographics Similar to Choctaw and Cherokee by 2 or more Vehicles in Household
In terms of 2 or more vehicles in household, the demographic groups most similar to Choctaw are Belgian (59.3%, a difference of 0.010%), Immigrants from India (59.3%, a difference of 0.040%), Yaqui (59.3%, a difference of 0.060%), Spaniard (59.2%, a difference of 0.14%), and Immigrants from Laos (59.2%, a difference of 0.14%). Similarly, the demographic groups most similar to Cherokee are Northern European (59.9%, a difference of 0.020%), Malaysian (59.8%, a difference of 0.030%), Czechoslovakian (59.8%, a difference of 0.11%), French (59.8%, a difference of 0.17%), and Immigrants from Taiwan (59.7%, a difference of 0.21%).
| Demographics | Rating | Rank | 2 or more Vehicles in Household |
| Immigrants | Philippines | 100.0 /100 | #35 | Exceptional 60.1% |
| Chinese | 100.0 /100 | #36 | Exceptional 60.1% |
| Irish | 100.0 /100 | #37 | Exceptional 60.1% |
| Americans | 100.0 /100 | #38 | Exceptional 60.0% |
| British | 100.0 /100 | #39 | Exceptional 60.0% |
| Cherokee | 100.0 /100 | #40 | Exceptional 59.9% |
| Northern Europeans | 100.0 /100 | #41 | Exceptional 59.9% |
| Malaysians | 100.0 /100 | #42 | Exceptional 59.8% |
| Czechoslovakians | 100.0 /100 | #43 | Exceptional 59.8% |
| French | 100.0 /100 | #44 | Exceptional 59.8% |
| Immigrants | Taiwan | 100.0 /100 | #45 | Exceptional 59.7% |
| Immigrants | South Eastern Asia | 100.0 /100 | #46 | Exceptional 59.6% |
| Yaqui | 99.9 /100 | #47 | Exceptional 59.3% |
| Immigrants | India | 99.9 /100 | #48 | Exceptional 59.3% |
| Belgians | 99.9 /100 | #49 | Exceptional 59.3% |
| Choctaw | 99.9 /100 | #50 | Exceptional 59.3% |
| Spaniards | 99.9 /100 | #51 | Exceptional 59.2% |
| Immigrants | Laos | 99.9 /100 | #52 | Exceptional 59.2% |
| Celtics | 99.9 /100 | #53 | Exceptional 59.2% |
| Bhutanese | 99.9 /100 | #54 | Exceptional 59.1% |
| Luxembourgers | 99.9 /100 | #55 | Exceptional 59.1% |